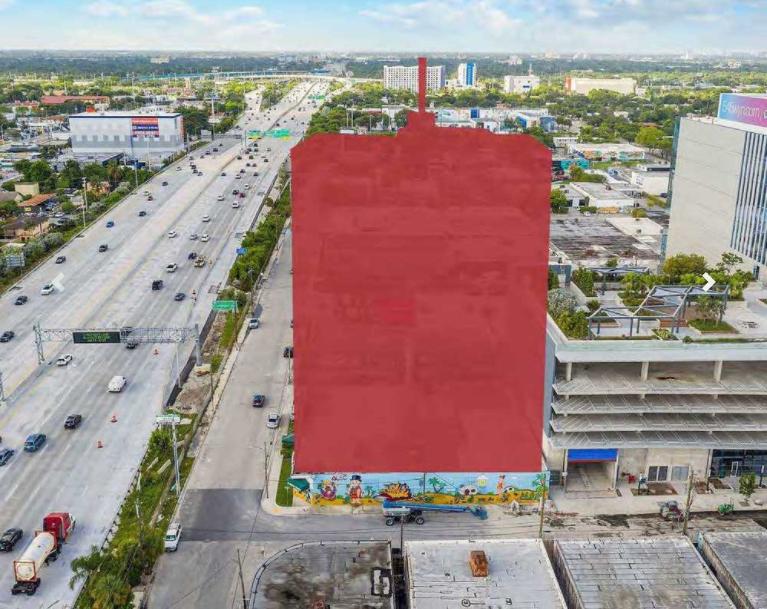
1-Mile | 3-Miles | 5-Miles | ||
---|---|---|---|---|
Total Population | 31,459 | 379,667 | 795,963 | |
Population Median Age | 37 | 39 | 40 | |
Population by Age | 0-9 Yrs | 4042 (12%) | 42161 (11%) | 87418 (10%) |
10-19 Yrs | 3592 (11%) | 33156 (8%) | 67990 (8%) | |
20-29 Yrs | 4840 (15%) | 55902 (14%) | 102334 (12%) | |
30-39 Yrs | 5369 (17%) | 76744 (20%) | 147168 (18%) | |
40-49 Yrs | 4058 (12%) | 54945 (14%) | 118805 (14%) | |
50-59 Yrs | 4048 (12%) | 47569 (12%) | 105795 (13%) | |
60-69 Yrs | 2946 (9%) | 35079 (9%) | 78339 (9%) | |
70+ Yrs | 2564 (8%) | 34112 (8%) | 88115 (11%) | |
Median HH Income | $33,162 | $45,134 | $51,320 | |
Total Household Income | < 24K | 4170 (38%) | 50808 (32%) | 94572 (28%) |
25-49K | 3113 (29%) | 32989 (20%) | 66726 (20%) | |
50-74K | 1623 (15%) | 23053 (14%) | 48054 (14%) | |
75-99K | 637 (5%) | 16310 (10%) | 35266 (10%) | |
100-199K | 1001 (9%) | 21756 (13%) | 50747 (15%) | |
200K+ | 165 (1%) | 12719 (8%) | 33253 (10%) | |
Highest Education Level | No Diploma | 5699 | 57350 | 102261 |
Diploma or GED | 6768 | 69088 | 139204 | |
Some College | 2972 | 35066 | 76789 | |
Assoc. Degree | 1553 | 19569 | 44315 | |
Bachelors Degree | 3363 | 57063 | 132511 | |
Higher Degree | 1382 | 45547 | 106606 | |
Total Housing Units | 12,248 | 195,755 | 414,946 | |
--Owner-Occupied | 1,882 | 40,519 | 112,160 | |
--Renter-Occupied | 8,827 | 117,116 | 216,457 | |
Owner-Occupied Values | < 100K | 144 | 4129 | 8985 |
100-199K | 458 | 5660 | 13996 | |
200-299K | 618 | 9895 | 24370 | |
300-399K | 275 | 5052 | 15251 | |
400-499K | 106 | 3879 | 10906 | |
500K+ | 281 | 11905 | 38651 | |
Total Working Age Population | 25,062 | 316,664 | 664,943 | |
In Work Force | 15,509 | 206,710 | 435,825 | |
Not In Work Force | 9,553 | 109,954 | 229,119 | |
Workforce Employed | 13,951 | 193,966 | 412,124 | |
Workforce Unemployed | 1,558 | 12,569 | 23,293 | |
Civlian Workforce | 15,509 | 206,534 | 435,416 | |
Military Workforce | 0 | 175 | 408 | |
Total Households | 10,709 | 157,635 | 328,617 | |
Family Households | 6,044 | 78,390 | 171,460 | |
Non-Family Households | 4,665 | 79,245 | 157,158 | |
Married Couple | 2,999 | 46,510 | 108,826 | |
Other Family | 3,045 | 31,881 | 62,634 | |
Married w/Child | 1,464 | 17,232 | 39,996 | |
Single Male w/Child | 143 | 3,051 | 5,868 | |
Single Female w/Child | 1,316 | 11,004 | 21,601 |
Population Change Last Two Decades - Plus Projection
2000 | % | 2010 | % | 2020 | % | 2030 | |
---|---|---|---|---|---|---|---|
Florida | 15,982,378 | +18 | 18,801,310 | +14 | 21,517,610 | +13 | 24,340,457 |
Miami-Dade County | 2,253,362 | +11 | 2,496,435 | +15 | 2,861,579 | +11 | 3,190,242 |
Monroe County | 79,589 | -8 | 73,090 | +1 | 74,004 | 0 | 74,301 |
Total Working Age Population:
Total Households:
Total Working Age Population:
Total Households:
Total Working Age Population:
Total Households: