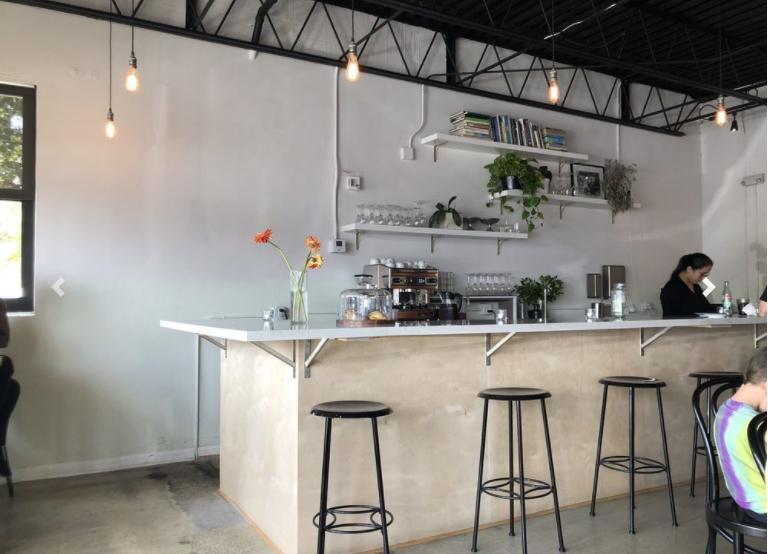
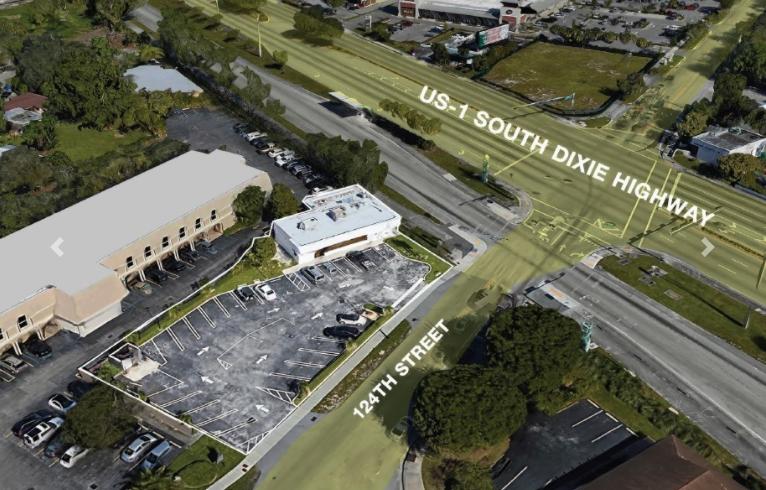
1-Mile | 3-Miles | 5-Miles | ||
---|---|---|---|---|
Total Population | 8,240 | 99,641 | 274,473 | |
Population Median Age | 41 | 40 | 40 | |
Population by Age | 0-9 Yrs | 776 (9%) | 10982 (11%) | 30245 (11%) |
10-19 Yrs | 1047 (12%) | 12612 (12%) | 33615 (12%) | |
20-29 Yrs | 1220 (14%) | 13139 (13%) | 37503 (13%) | |
30-39 Yrs | 860 (10%) | 11981 (12%) | 33240 (12%) | |
40-49 Yrs | 1048 (12%) | 12927 (12%) | 37006 (13%) | |
50-59 Yrs | 1349 (16%) | 15476 (15%) | 40898 (14%) | |
60-69 Yrs | 991 (12%) | 11329 (11%) | 30181 (10%) | |
70+ Yrs | 948 (11%) | 11194 (11%) | 31786 (11%) | |
Median HH Income | $113,747 | $91,500 | $77,562 | |
Total Household Income | < 24K | 211 (8%) | 4825 (14%) | 13977 (15%) |
25-49K | 375 (14%) | 5002 (14%) | 15730 (17%) | |
50-74K | 355 (13%) | 4722 (13%) | 13780 (15%) | |
75-99K | 248 (9%) | 3583 (10%) | 10704 (12%) | |
100-199K | 836 (31%) | 8307 (24%) | 21337 (23%) | |
200K+ | 603 (22%) | 7389 (21%) | 13640 (15%) | |
Highest Education Level | No Diploma | 276 | 4555 | 17329 |
Diploma or GED | 989 | 11854 | 39786 | |
Some College | 1025 | 11033 | 32303 | |
Assoc. Degree | 540 | 6231 | 18442 | |
Bachelors Degree | 1673 | 19544 | 48324 | |
Higher Degree | 1341 | 16729 | 36117 | |
Total Housing Units | 2,866 | 37,102 | 97,304 | |
--Owner-Occupied | 2,114 | 22,985 | 60,370 | |
--Renter-Occupied | 514 | 10,842 | 28,797 | |
Owner-Occupied Values | < 100K | 34 | 647 | 1551 |
100-199K | 63 | 2265 | 7469 | |
200-299K | 105 | 2226 | 11903 | |
300-399K | 231 | 2005 | 9933 | |
400-499K | 234 | 2617 | 6730 | |
500K+ | 1446 | 13226 | 22784 | |
Total Working Age Population | 6,749 | 80,678 | 223,951 | |
In Work Force | 4,308 | 52,270 | 143,029 | |
Not In Work Force | 2,441 | 28,408 | 80,922 | |
Workforce Employed | 4,181 | 49,913 | 136,668 | |
Workforce Unemployed | 128 | 2,333 | 6,290 | |
Civlian Workforce | 4,308 | 52,246 | 142,958 | |
Military Workforce | 0 | 24 | 71 | |
Total Households | 2,628 | 33,827 | 89,168 | |
Family Households | 1,957 | 24,440 | 65,307 | |
Non-Family Households | 671 | 9,387 | 23,860 | |
Married Couple | 1,473 | 18,926 | 47,270 | |
Other Family | 484 | 5,514 | 18,037 | |
Married w/Child | 505 | 7,662 | 19,411 | |
Single Male w/Child | 11 | 432 | 1,661 | |
Single Female w/Child | 162 | 1,471 | 4,811 |
Population Change Last Two Decades - Plus Projection
2000 | % | 2010 | % | 2020 | % | 2030 | |
---|---|---|---|---|---|---|---|
Florida | 15,982,378 | +18 | 18,801,310 | +14 | 21,517,610 | +13 | 24,340,457 |
Miami-Dade County | 2,253,362 | +11 | 2,496,435 | +15 | 2,861,579 | +11 | 3,190,242 |
Monroe County | 79,589 | -8 | 73,090 | +1 | 74,004 | 0 | 74,301 |
Total Working Age Population:
Total Households:
Total Working Age Population:
Total Households:
Total Working Age Population:
Total Households: