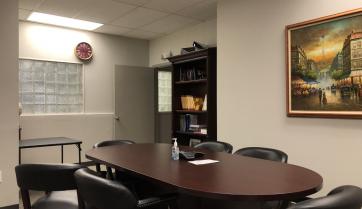
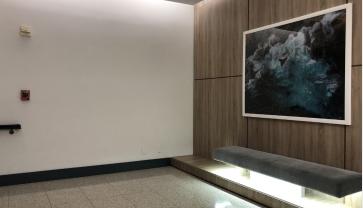
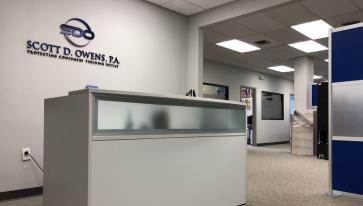
1-Mile | 3-Miles | 5-Miles | ||
---|---|---|---|---|
Total Population | 28,674 | 139,596 | 328,996 | |
Population Median Age | 52 | 45 | 44 | |
Population by Age | 0-9 Yrs | 1915 (6%) | 12678 (9%) | 32894 (9%) |
10-19 Yrs | 1143 (3%) | 11386 (8%) | 29175 (8%) | |
20-29 Yrs | 2636 (9%) | 15197 (10%) | 36528 (11%) | |
30-39 Yrs | 2916 (10%) | 17274 (12%) | 44336 (13%) | |
40-49 Yrs | 2431 (8%) | 17852 (12%) | 42932 (13%) | |
50-59 Yrs | 4061 (14%) | 21466 (15%) | 49419 (15%) | |
60-69 Yrs | 6013 (20%) | 20124 (14%) | 43907 (13%) | |
70+ Yrs | 7561 (26%) | 23620 (16%) | 49806 (15%) | |
Median HH Income | $55,116 | $52,904 | $51,090 | |
Total Household Income | < 24K | 3483 (22%) | 15005 (24%) | 33746 (24%) |
25-49K | 3533 (22%) | 14796 (23%) | 35286 (25%) | |
50-74K | 2843 (18%) | 9633 (15%) | 23885 (16%) | |
75-99K | 1436 (9%) | 5676 (9%) | 14206 (10%) | |
100-199K | 3155 (20%) | 11313 (18%) | 22758 (16%) | |
200K+ | 1149 (7%) | 5967 (9%) | 10625 (7%) | |
Highest Education Level | No Diploma | 1818 | 10443 | 25357 |
Diploma or GED | 4726 | 22137 | 56572 | |
Some College | 4258 | 20834 | 51950 | |
Assoc. Degree | 2333 | 9970 | 25177 | |
Bachelors Degree | 6194 | 26363 | 53815 | |
Higher Degree | 5071 | 18765 | 36974 | |
Total Housing Units | 33,764 | 107,952 | 222,617 | |
--Owner-Occupied | 10,613 | 35,705 | 78,794 | |
--Renter-Occupied | 4,986 | 26,685 | 61,711 | |
Owner-Occupied Values | < 100K | 402 | 2604 | 8950 |
100-199K | 1903 | 5898 | 18501 | |
200-299K | 2515 | 6714 | 15435 | |
300-399K | 2547 | 6253 | 11658 | |
400-499K | 999 | 3325 | 5501 | |
500K+ | 2247 | 10912 | 18749 | |
Total Working Age Population | 26,026 | 119,362 | 277,854 | |
In Work Force | 13,351 | 71,809 | 172,723 | |
Not In Work Force | 12,675 | 47,553 | 105,131 | |
Workforce Employed | 12,762 | 67,548 | 162,287 | |
Workforce Unemployed | 589 | 4,249 | 10,312 | |
Civlian Workforce | 13,351 | 71,797 | 172,599 | |
Military Workforce | 0 | 12 | 124 | |
Total Households | 15,599 | 62,390 | 140,506 | |
Family Households | 7,486 | 33,894 | 78,000 | |
Non-Family Households | 8,113 | 28,497 | 62,505 | |
Married Couple | 6,201 | 24,688 | 54,511 | |
Other Family | 1,285 | 9,206 | 23,489 | |
Married w/Child | 1,043 | 7,028 | 16,856 | |
Single Male w/Child | 135 | 801 | 2,554 | |
Single Female w/Child | 406 | 3,095 | 7,596 |
Population Change Last Two Decades - Plus Projection
2000 | % | 2010 | % | 2020 | % | 2030 | |
---|---|---|---|---|---|---|---|
Florida | 15,982,378 | +18 | 18,801,310 | +14 | 21,517,610 | +13 | 24,340,457 |
Broward County | 1,623,018 | +8 | 1,748,066 | +11 | 1,942,686 | +9 | 2,120,334 |
Miami-Dade County | 2,253,362 | +11 | 2,496,435 | +15 | 2,861,579 | +11 | 3,190,242 |
Total Working Age Population:
Total Households:
Total Working Age Population:
Total Households:
Total Working Age Population:
Total Households: