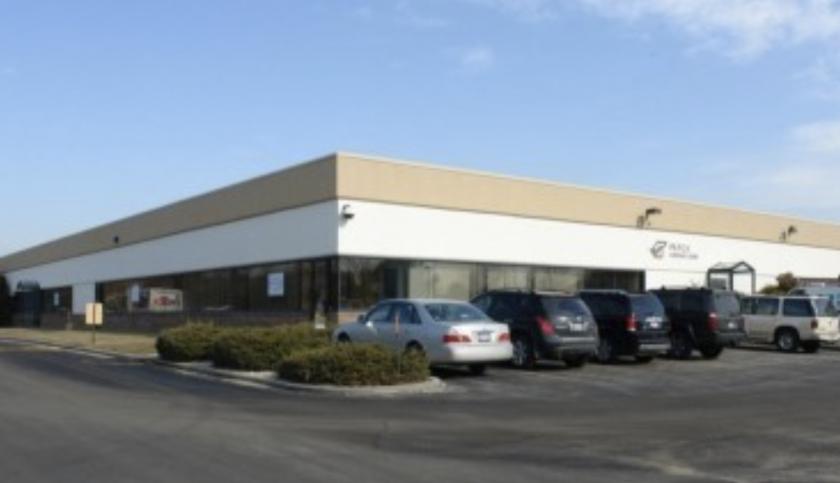
Office Space
125 Wireless Boulevard Hauppauge, NY 11788
125 Wireless Boulevard Hauppauge, NY 11788
Details & Description
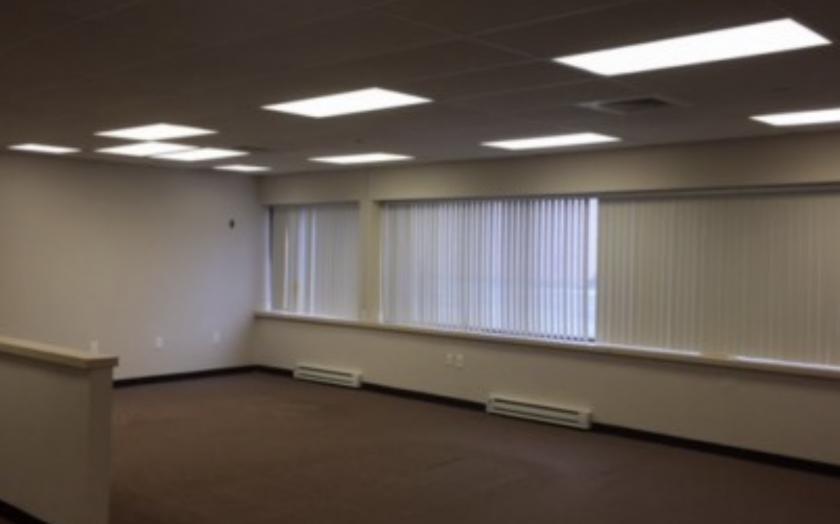
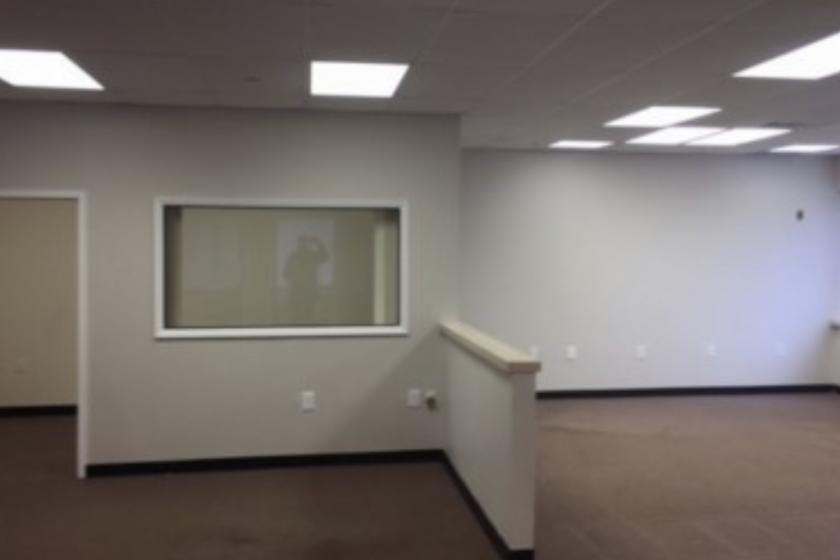
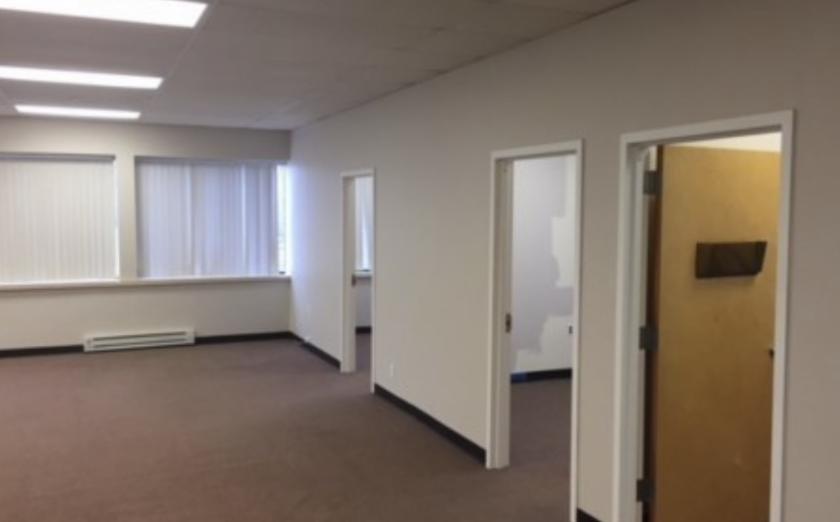
Additional Photos
Listing Agents

Steven Reichman
O: 631-761-6890
M: 631-544-4447
sreichman@nailongisland.com
O: 631-761-6890
M: 631-544-4447
sreichman@nailongisland.com

Lee Rosner
O: 631-761-6886
M: 631-786-0557
lrosner@nailongisland.com
O: 631-761-6886
M: 631-786-0557
lrosner@nailongisland.com
While we strive to provide the most accurate information, all listing information, and demographic data, is provided by third-parties. As such, MyEListing will not be responsible for the accuracy of the information. It is strongly recommended that you verify all information with the listing agent, and any relevant agencies, prior to making any decisions.


