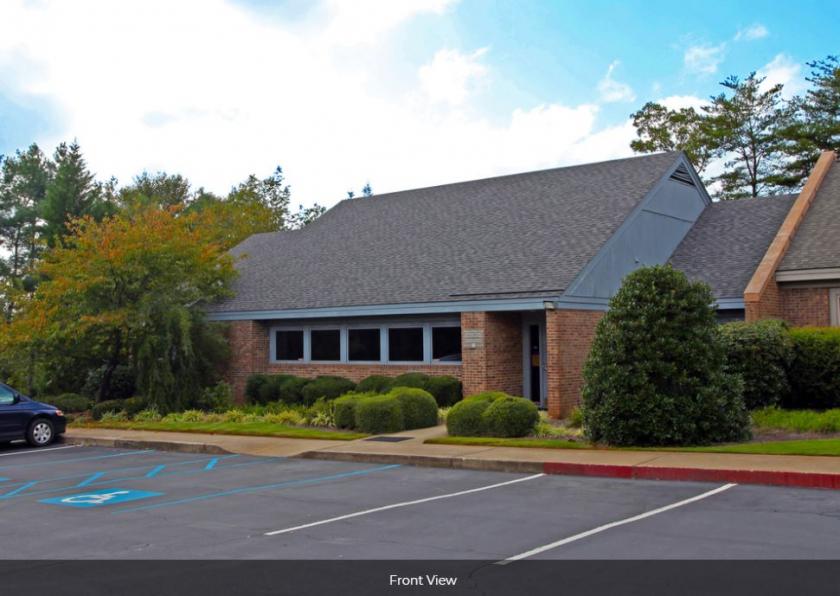
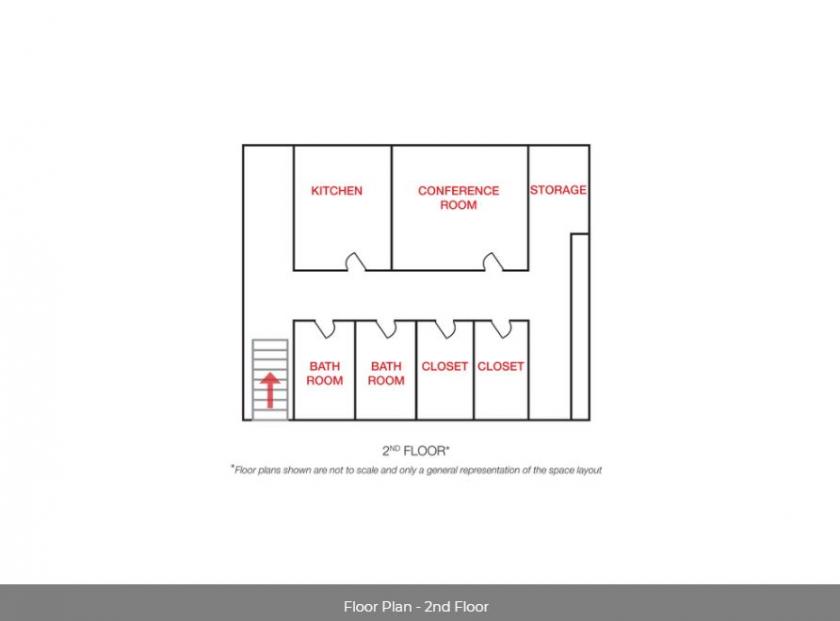
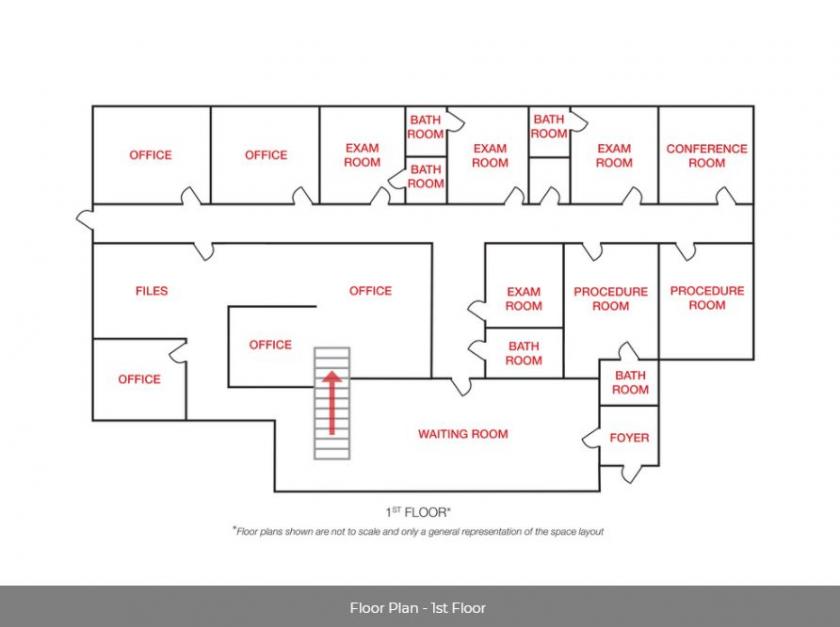
1-Mile | 3-Miles | 5-Miles | ||
---|---|---|---|---|
Total Population | 5,402 | 52,090 | 123,385 | |
Population Median Age | 41 | 38 | 37 | |
Population by Age | 0-9 Yrs | 502 (9%) | 7841 (15%) | 17747 (14%) |
10-19 Yrs | 723 (13%) | 5447 (10%) | 13707 (11%) | |
20-29 Yrs | 837 (15%) | 7894 (15%) | 19356 (15%) | |
30-39 Yrs | 566 (10%) | 6781 (13%) | 17612 (14%) | |
40-49 Yrs | 641 (11%) | 5779 (11%) | 15110 (12%) | |
50-59 Yrs | 617 (11%) | 7100 (13%) | 16200 (13%) | |
60-69 Yrs | 733 (13%) | 5697 (10%) | 12350 (10%) | |
70+ Yrs | 782 (14%) | 5550 (10%) | 11303 (9%) | |
Median HH Income | $37,056 | $41,848 | $43,810 | |
Total Household Income | < 24K | 725 (30%) | 6710 (31%) | 14077 (28%) |
25-49K | 597 (25%) | 5150 (24%) | 12950 (26%) | |
50-74K | 449 (19%) | 3158 (14%) | 7978 (16%) | |
75-99K | 191 (8%) | 1560 (7%) | 4347 (8%) | |
100-199K | 197 (8%) | 2701 (12%) | 6237 (12%) | |
200K+ | 197 (8%) | 1950 (9%) | 3305 (6%) | |
Highest Education Level | No Diploma | 898 | 6991 | 17200 |
Diploma or GED | 1009 | 8817 | 21051 | |
Some College | 585 | 5562 | 13912 | |
Assoc. Degree | 161 | 2203 | 5835 | |
Bachelors Degree | 748 | 6968 | 15923 | |
Higher Degree | 420 | 4711 | 9645 | |
Total Housing Units | 2,691 | 24,012 | 54,758 | |
--Owner-Occupied | 1,446 | 11,339 | 25,542 | |
--Renter-Occupied | 910 | 9,890 | 23,353 | |
Owner-Occupied Values | < 100K | 646 | 3809 | 8138 |
100-199K | 365 | 2603 | 7172 | |
200-299K | 45 | 1077 | 3199 | |
300-399K | 46 | 680 | 2006 | |
400-499K | 24 | 740 | 1343 | |
500K+ | 320 | 2430 | 3684 | |
Total Working Age Population | 4,551 | 40,934 | 96,993 | |
In Work Force | 2,737 | 25,519 | 61,593 | |
Not In Work Force | 1,814 | 15,414 | 35,400 | |
Workforce Employed | 2,535 | 23,714 | 57,945 | |
Workforce Unemployed | 202 | 1,771 | 3,556 | |
Civlian Workforce | 2,737 | 25,485 | 61,501 | |
Military Workforce | 0 | 35 | 92 | |
Total Households | 2,356 | 21,229 | 48,895 | |
Family Households | 1,283 | 11,831 | 28,113 | |
Non-Family Households | 1,073 | 9,397 | 20,782 | |
Married Couple | 966 | 7,779 | 17,674 | |
Other Family | 317 | 4,052 | 10,439 | |
Married w/Child | 306 | 3,001 | 7,015 | |
Single Male w/Child | 33 | 305 | 1,184 | |
Single Female w/Child | 125 | 1,773 | 3,973 |
Population Change Last Two Decades - Plus Projection
2000 | % | 2010 | % | 2020 | % | 2030 | |
---|---|---|---|---|---|---|---|
South Carolina | 4,012,012 | +15 | 4,625,364 | +9 | 5,020,400 | +9 | 5,488,460 |
Anderson County | 165,740 | +13 | 187,126 | +8 | 201,730 | +8 | 218,520 |
Greenville County | 379,616 | +19 | 451,225 | +9 | 492,890 | +10 | 542,290 |
Pickens County | 110,757 | +8 | 119,224 | +14 | 135,920 | +11 | 150,420 |
Total Working Age Population:
Total Households:
Total Working Age Population:
Total Households:
Total Working Age Population:
Total Households: