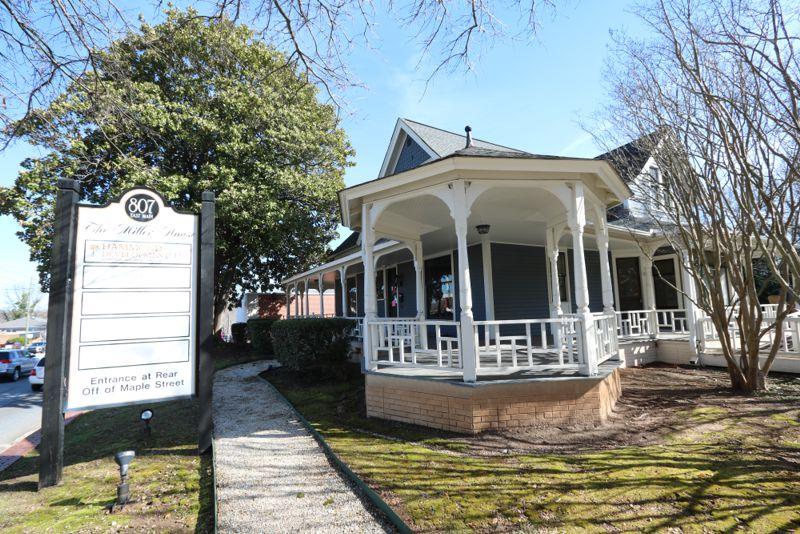
Office Space
807 East Main Street Spartanburg, SC 29302
807 East Main Street Spartanburg, SC 29302
Details & Description
Property Highlights
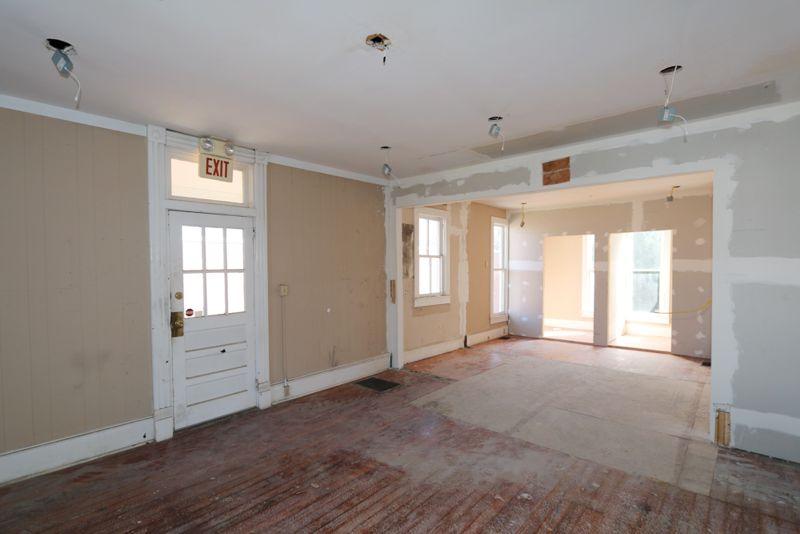
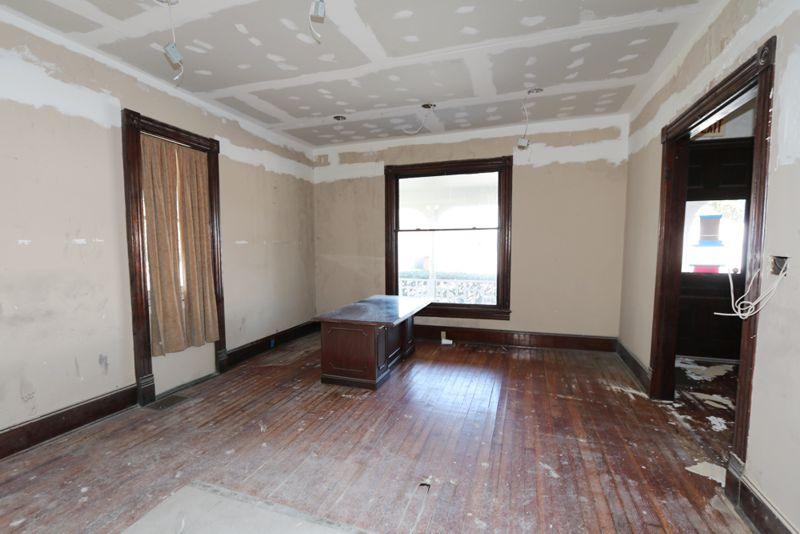
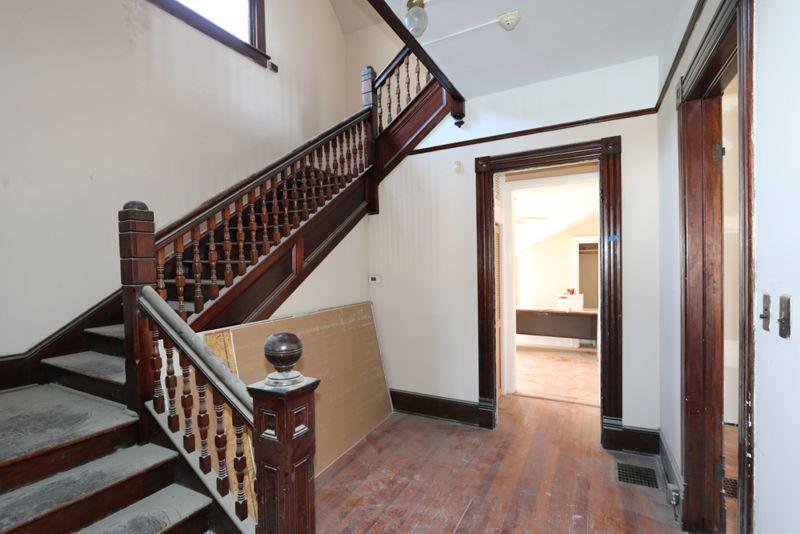
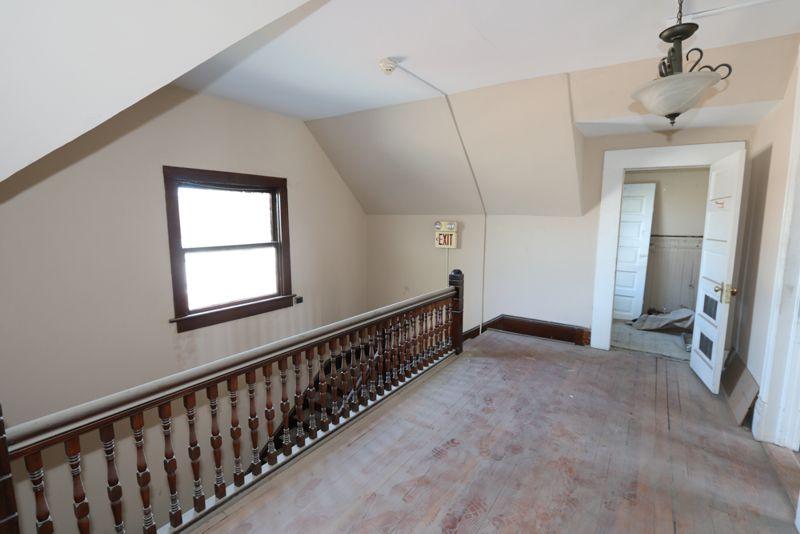
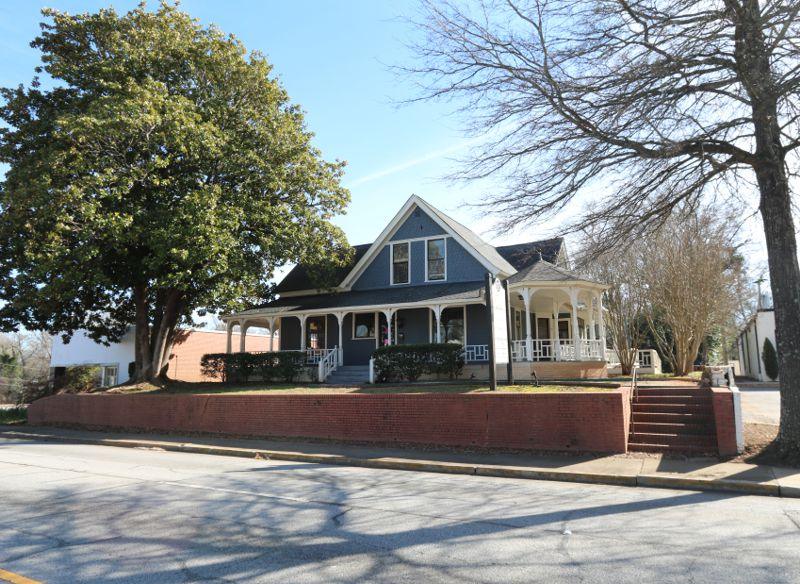
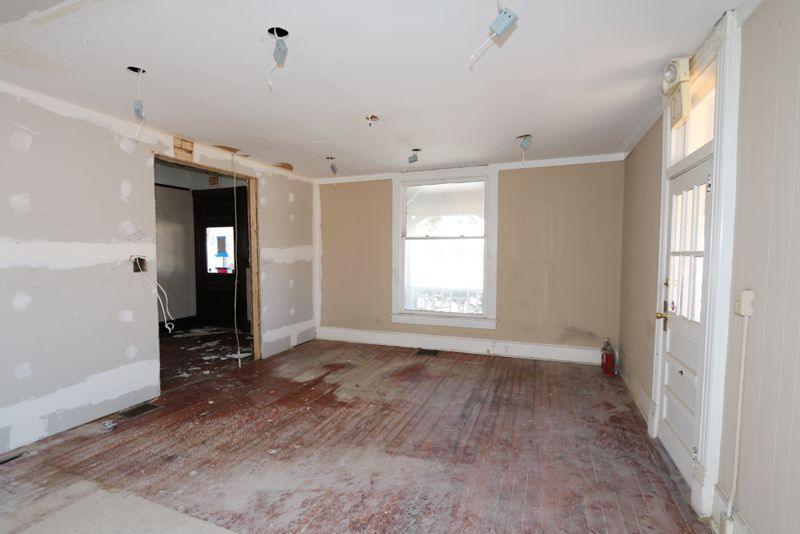
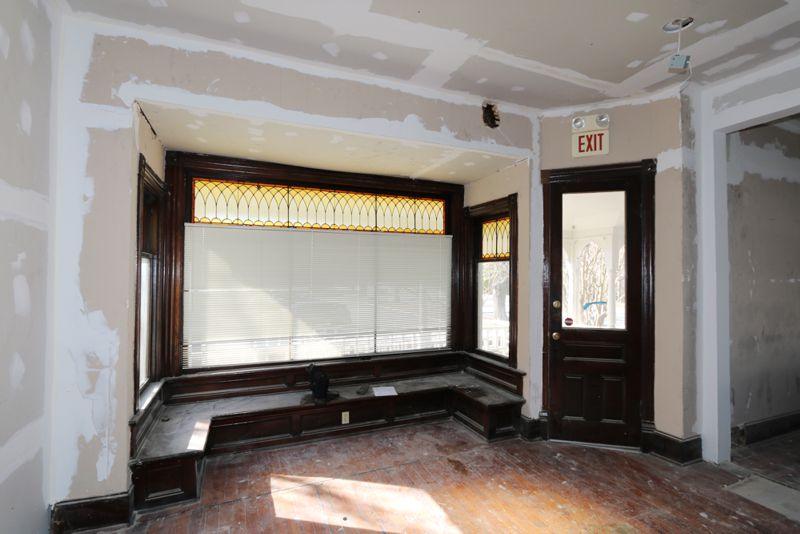
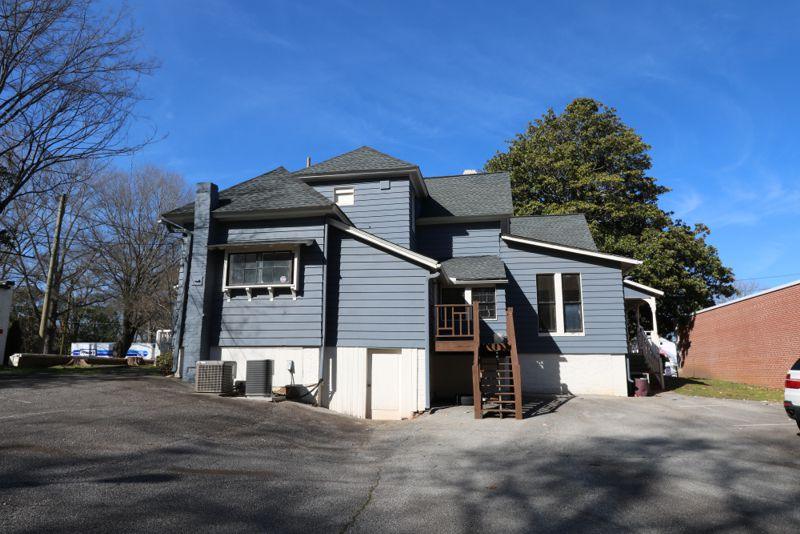
- • Older House Partially Renovated
- • Zoned City of Spartanburg Limited Office District
- • 1/2+- mile from downtown Spartanburg
- • 2021 Traffic count of 26,000 vpd
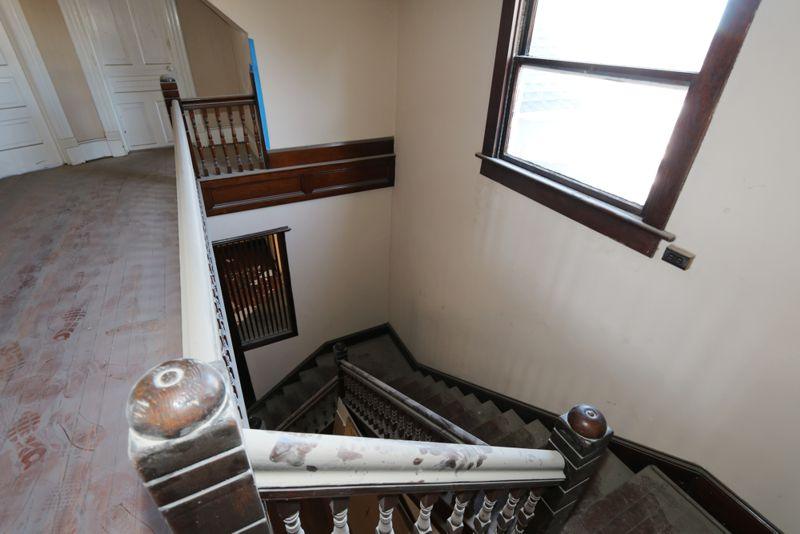
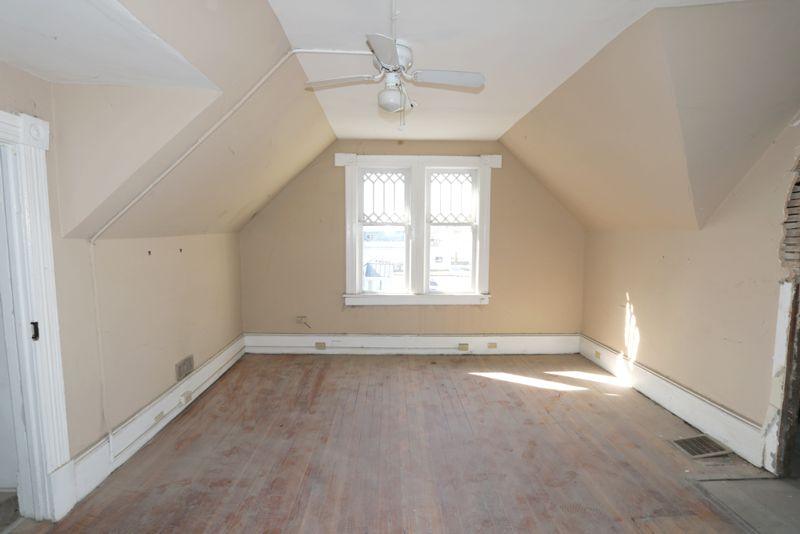
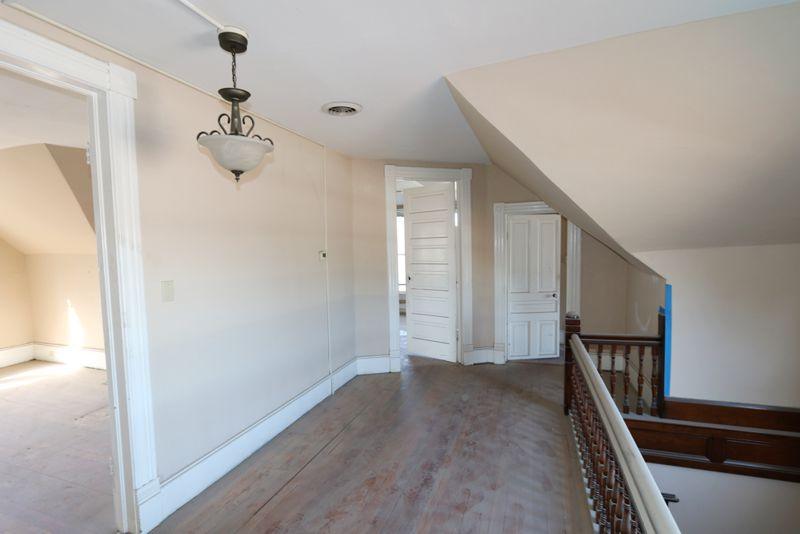
Additional Photos
Listing Agents

Glenn Young
O: 864-848-9070
M: 864-384-4999
gyoung@langston-black.com
O: 864-848-9070
M: 864-384-4999
gyoung@langston-black.com
While we strive to provide the most accurate information, all listing information, and demographic data, is provided by third-parties. As such, MyEListing will not be responsible for the accuracy of the information. It is strongly recommended that you verify all information with the listing agent, and any relevant agencies, prior to making any decisions.