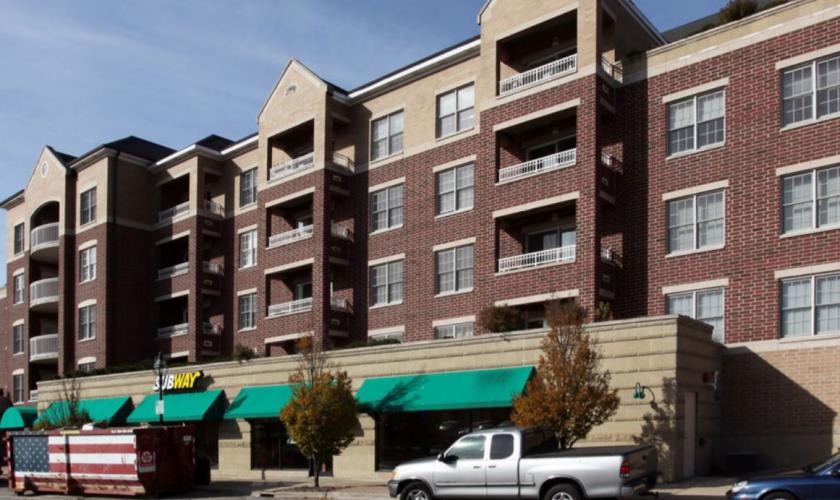
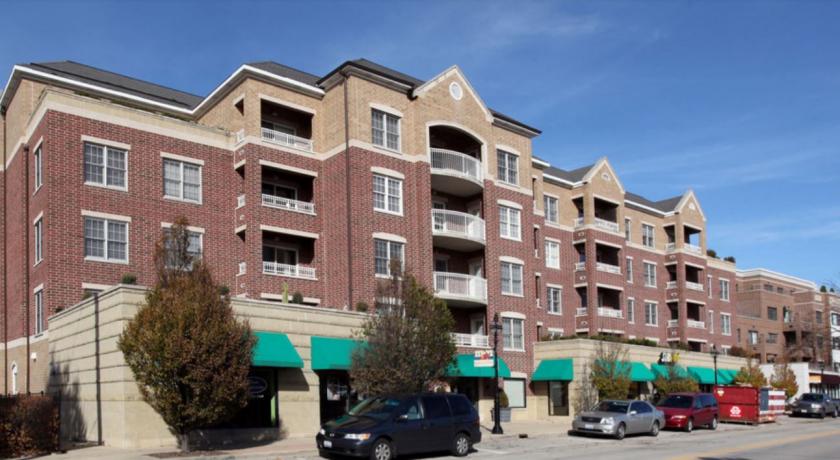
1-Mile | 3-Miles | 5-Miles | ||
---|---|---|---|---|
Total Population | 14,770 | 121,427 | 274,703 | |
Population Median Age | 39 | 38 | 39 | |
Population by Age | 0-9 Yrs | 2212 (14%) | 16647 (13%) | 34779 (12%) |
10-19 Yrs | 2277 (15%) | 16925 (13%) | 35704 (12%) | |
20-29 Yrs | 1057 (7%) | 16357 (13%) | 36278 (13%) | |
30-39 Yrs | 1646 (11%) | 16420 (13%) | 37418 (13%) | |
40-49 Yrs | 2103 (14%) | 13906 (11%) | 32624 (11%) | |
50-59 Yrs | 2273 (15%) | 16251 (13%) | 37773 (13%) | |
60-69 Yrs | 1625 (11%) | 13718 (11%) | 32207 (11%) | |
70+ Yrs | 1577 (10%) | 11204 (9%) | 27920 (10%) | |
Median HH Income | $134,711 | $88,541 | $86,522 | |
Total Household Income | < 24K | 656 (11%) | 5123 (11%) | 11428 (11%) |
25-49K | 656 (11%) | 7252 (16%) | 16626 (16%) | |
50-74K | 522 (9%) | 6902 (15%) | 16255 (16%) | |
75-99K | 352 (6%) | 5094 (11%) | 13627 (13%) | |
100-199K | 1557 (28%) | 13211 (29%) | 30712 (30%) | |
200K+ | 1805 (32%) | 6491 (14%) | 12532 (12%) | |
Highest Education Level | No Diploma | 197 | 5682 | 14455 |
Diploma or GED | 814 | 12625 | 34644 | |
Some College | 1009 | 13950 | 34563 | |
Assoc. Degree | 463 | 5446 | 13237 | |
Bachelors Degree | 4185 | 25516 | 55999 | |
Higher Degree | 3063 | 16512 | 33795 | |
Total Housing Units | 5,706 | 46,660 | 106,565 | |
--Owner-Occupied | 4,430 | 30,359 | 71,778 | |
--Renter-Occupied | 1,118 | 13,715 | 29,401 | |
Owner-Occupied Values | < 100K | 34 | 1259 | 3325 |
100-199K | 247 | 4871 | 13087 | |
200-299K | 309 | 8098 | 23408 | |
300-399K | 809 | 6424 | 14181 | |
400-499K | 699 | 3348 | 6762 | |
500K+ | 2333 | 6357 | 11016 | |
Total Working Age Population | 11,153 | 95,183 | 218,683 | |
In Work Force | 7,305 | 64,842 | 150,113 | |
Not In Work Force | 3,847 | 30,342 | 68,571 | |
Workforce Employed | 7,018 | 62,082 | 144,042 | |
Workforce Unemployed | 287 | 2,707 | 6,003 | |
Civlian Workforce | 7,305 | 64,789 | 150,045 | |
Military Workforce | 0 | 52 | 68 | |
Total Households | 5,548 | 44,073 | 101,179 | |
Family Households | 3,958 | 30,803 | 69,876 | |
Non-Family Households | 1,590 | 13,270 | 31,303 | |
Married Couple | 3,516 | 24,962 | 56,394 | |
Other Family | 443 | 5,841 | 13,482 | |
Married w/Child | 1,737 | 11,434 | 24,138 | |
Single Male w/Child | 16 | 610 | 1,509 | |
Single Female w/Child | 317 | 2,559 | 4,926 |
Population Change Last Two Decades - Plus Projection
2000 | % | 2010 | % | 2020 | % | 2030 | |
---|---|---|---|---|---|---|---|
Illinois | 12,419,293 | +3 | 12,830,632 | +12 | 14,316,487 | +6 | 15,138,849 |
Cook County | 5,376,741 | -3 | 5,194,675 | +10 | 5,707,832 | +5 | 5,990,243 |
DuPage County | 904,161 | +1 | 916,924 | +10 | 1,010,323 | +2 | 1,034,039 |
Total Working Age Population:
Total Households:
Total Working Age Population:
Total Households:
Total Working Age Population:
Total Households: