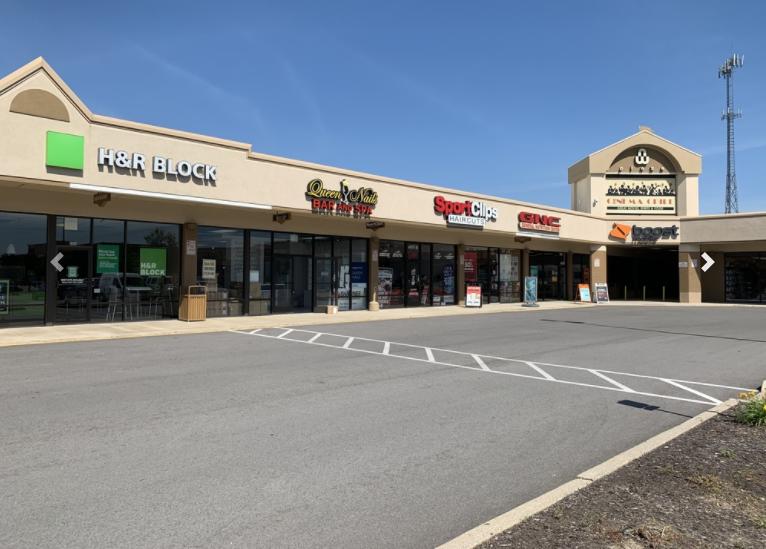
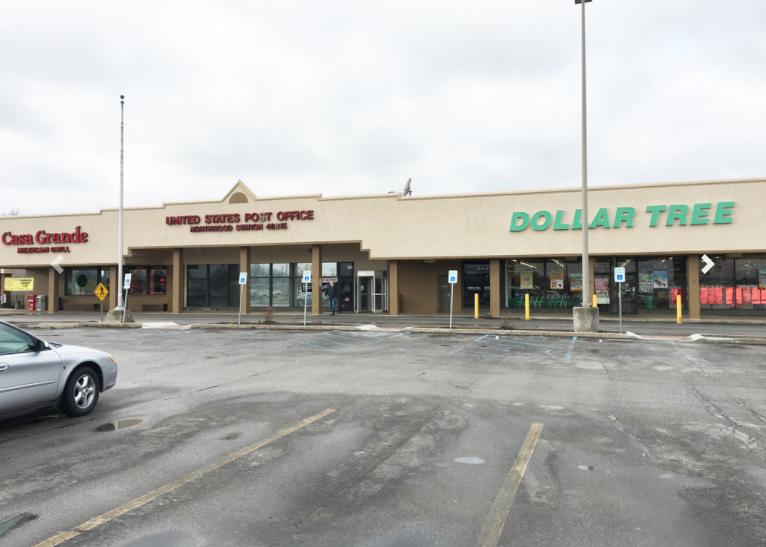
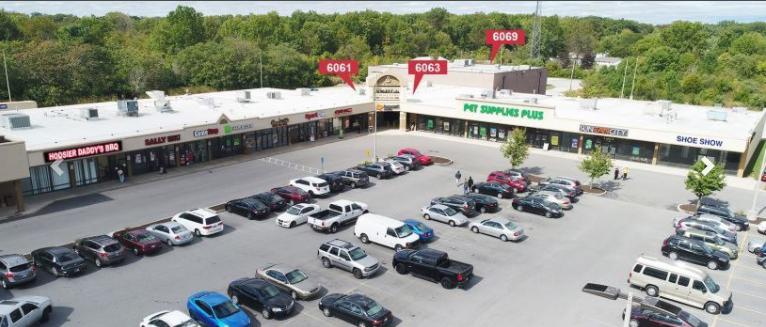
1-Mile | 3-Miles | 5-Miles | ||
---|---|---|---|---|
Total Population | 10,579 | 69,197 | 138,188 | |
Population Median Age | 38 | 39 | 37 | |
Population by Age | 0-9 Yrs | 1518 (14%) | 9136 (13%) | 18832 (13%) |
10-19 Yrs | 1579 (14%) | 8877 (12%) | 18127 (13%) | |
20-29 Yrs | 1122 (10%) | 10885 (15%) | 22035 (15%) | |
30-39 Yrs | 1552 (14%) | 8439 (12%) | 17986 (13%) | |
40-49 Yrs | 1380 (13%) | 7933 (11%) | 15991 (11%) | |
50-59 Yrs | 1209 (11%) | 7835 (11%) | 16331 (11%) | |
60-69 Yrs | 1010 (9%) | 7582 (10%) | 14832 (10%) | |
70+ Yrs | 1209 (11%) | 8509 (12%) | 14055 (10%) | |
Median HH Income | $60,166 | $55,181 | $52,234 | |
Total Household Income | < 24K | 522 (13%) | 5156 (18%) | 11752 (21%) |
25-49K | 933 (23%) | 7356 (26%) | 14805 (26%) | |
50-74K | 986 (25%) | 5915 (21%) | 11550 (20%) | |
75-99K | 624 (15%) | 4041 (14%) | 7459 (13%) | |
100-199K | 745 (19%) | 4630 (16%) | 8404 (15%) | |
200K+ | 111 (2%) | 830 (2%) | 1472 (2%) | |
Highest Education Level | No Diploma | 311 | 2984 | 8556 |
Diploma or GED | 1848 | 11934 | 25261 | |
Some College | 1808 | 11356 | 20991 | |
Assoc. Degree | 924 | 5061 | 9849 | |
Bachelors Degree | 1114 | 9274 | 17348 | |
Higher Degree | 747 | 4814 | 8419 | |
Total Housing Units | 4,074 | 29,765 | 60,345 | |
--Owner-Occupied | 3,267 | 18,872 | 35,747 | |
--Renter-Occupied | 653 | 9,057 | 19,695 | |
Owner-Occupied Values | < 100K | 974 | 5357 | 13466 |
100-199K | 2146 | 11245 | 17444 | |
200-299K | 99 | 1582 | 3189 | |
300-399K | 13 | 490 | 1129 | |
400-499K | 8 | 98 | 278 | |
500K+ | 27 | 98 | 241 | |
Total Working Age Population | 8,072 | 54,586 | 108,407 | |
In Work Force | 5,624 | 36,466 | 72,694 | |
Not In Work Force | 2,448 | 18,121 | 35,713 | |
Workforce Employed | 5,282 | 34,813 | 69,063 | |
Workforce Unemployed | 342 | 1,613 | 3,569 | |
Civlian Workforce | 5,623 | 36,426 | 72,632 | |
Military Workforce | 0 | 40 | 62 | |
Total Households | 3,920 | 27,929 | 55,442 | |
Family Households | 2,729 | 17,141 | 33,855 | |
Non-Family Households | 1,192 | 10,788 | 21,587 | |
Married Couple | 1,957 | 12,899 | 24,612 | |
Other Family | 771 | 4,242 | 9,242 | |
Married w/Child | 810 | 4,965 | 9,672 | |
Single Male w/Child | 145 | 670 | 1,602 | |
Single Female w/Child | 255 | 1,668 | 3,810 |
Population Change Last Two Decades - Plus Projection
2000 | % | 2010 | % | 2020 | % | 2030 | |
---|---|---|---|---|---|---|---|
Indiana | 6,080,485 | +7 | 6,483,802 | +4 | 6,738,573 | +4 | 7,014,880 |
Allen County | 331,849 | +7 | 355,329 | +7 | 379,671 | +6 | 402,948 |
Total Working Age Population:
Total Households:
Total Working Age Population:
Total Households:
Total Working Age Population:
Total Households: