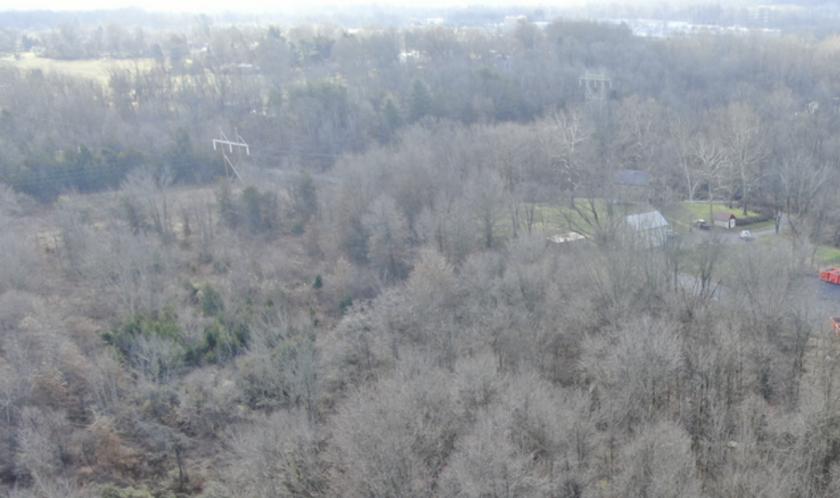
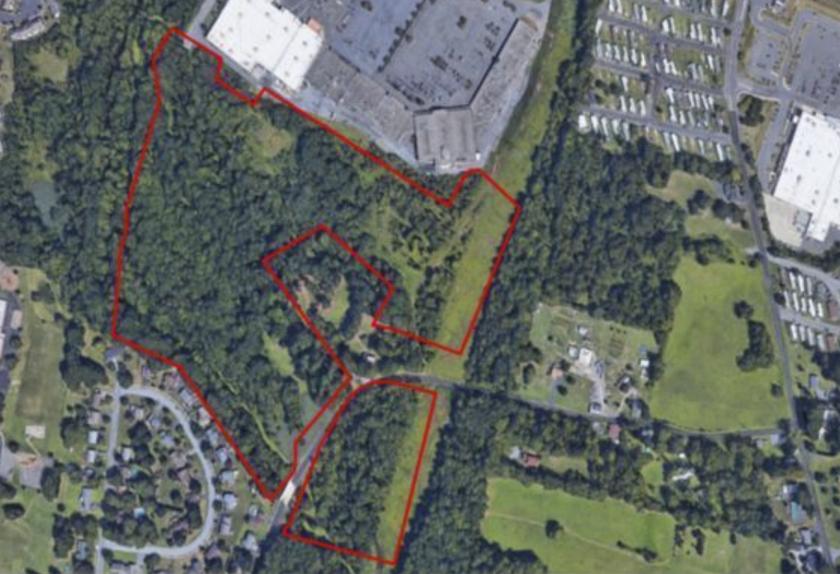
1-Mile | 3-Miles | 5-Miles | ||
---|---|---|---|---|
Total Population | 5,312 | 29,557 | 84,084 | |
Population Median Age | 43 | 41 | 39 | |
Population by Age | 0-9 Yrs | 488 (9%) | 3128 (10%) | 10348 (12%) |
10-19 Yrs | 700 (13%) | 4140 (14%) | 11580 (13%) | |
20-29 Yrs | 521 (9%) | 2828 (9%) | 10805 (12%) | |
30-39 Yrs | 488 (9%) | 3516 (11%) | 10023 (11%) | |
40-49 Yrs | 743 (13%) | 4131 (13%) | 10567 (12%) | |
50-59 Yrs | 891 (16%) | 4552 (15%) | 11749 (13%) | |
60-69 Yrs | 760 (14%) | 3724 (12%) | 9789 (11%) | |
70+ Yrs | 721 (13%) | 3539 (11%) | 9222 (10%) | |
Median HH Income | $77,151 | $79,639 | $59,158 | |
Total Household Income | < 24K | 173 (8%) | 1160 (10%) | 6429 (20%) |
25-49K | 335 (16%) | 1847 (16%) | 6823 (21%) | |
50-74K | 494 (24%) | 2280 (20%) | 5424 (17%) | |
75-99K | 272 (13%) | 1676 (14%) | 4099 (13%) | |
100-199K | 692 (33%) | 3628 (32%) | 7163 (23%) | |
200K+ | 84 (4%) | 605 (5%) | 1190 (3%) | |
Highest Education Level | No Diploma | 233 | 1692 | 8351 |
Diploma or GED | 1424 | 7076 | 20210 | |
Some College | 559 | 3377 | 9235 | |
Assoc. Degree | 238 | 1957 | 4834 | |
Bachelors Degree | 994 | 4356 | 8893 | |
Higher Degree | 497 | 2617 | 5282 | |
Total Housing Units | 2,114 | 11,740 | 33,894 | |
--Owner-Occupied | 1,607 | 9,229 | 21,097 | |
--Renter-Occupied | 441 | 1,967 | 10,029 | |
Owner-Occupied Values | < 100K | 125 | 1008 | 5104 |
100-199K | 675 | 4147 | 8592 | |
200-299K | 613 | 2977 | 5180 | |
300-399K | 152 | 788 | 1449 | |
400-499K | 34 | 161 | 334 | |
500K+ | 9 | 147 | 438 | |
Total Working Age Population | 4,340 | 24,004 | 67,158 | |
In Work Force | 2,730 | 16,413 | 43,971 | |
Not In Work Force | 1,611 | 7,592 | 23,186 | |
Workforce Employed | 2,600 | 15,702 | 40,823 | |
Workforce Unemployed | 121 | 688 | 3,126 | |
Civlian Workforce | 2,722 | 16,391 | 43,949 | |
Military Workforce | 8 | 22 | 22 | |
Total Households | 2,049 | 11,196 | 31,126 | |
Family Households | 1,530 | 8,108 | 20,673 | |
Non-Family Households | 519 | 3,088 | 10,453 | |
Married Couple | 1,242 | 6,515 | 14,294 | |
Other Family | 288 | 1,593 | 6,379 | |
Married w/Child | 344 | 2,463 | 5,351 | |
Single Male w/Child | 17 | 266 | 874 | |
Single Female w/Child | 177 | 698 | 2,849 |
Population Change Last Two Decades - Plus Projection
2000 | % | 2010 | % | 2020 | % | 2030 | |
---|---|---|---|---|---|---|---|
Pennsylvania | 12,281,054 | +3 | 12,702,379 | +4 | 13,230,170 | +4 | 13,759,594 |
Berks County | 373,638 | +10 | 411,442 | +7 | 440,143 | +7 | 471,457 |
Chester County | 433,501 | +15 | 498,886 | +7 | 533,837 | +7 | 573,576 |
Lancaster County | 470,658 | +10 | 519,445 | +8 | 559,247 | +8 | 602,153 |
Total Working Age Population:
Total Households:
Total Working Age Population:
Total Households:
Total Working Age Population:
Total Households: