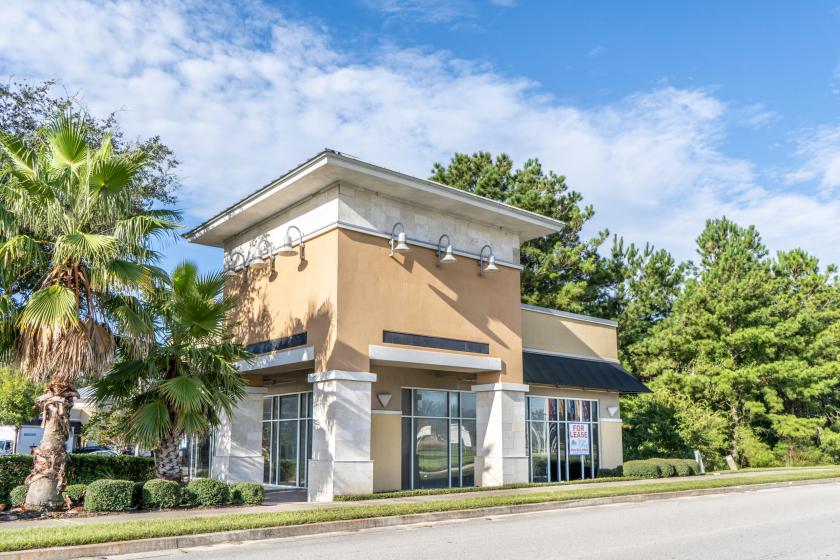
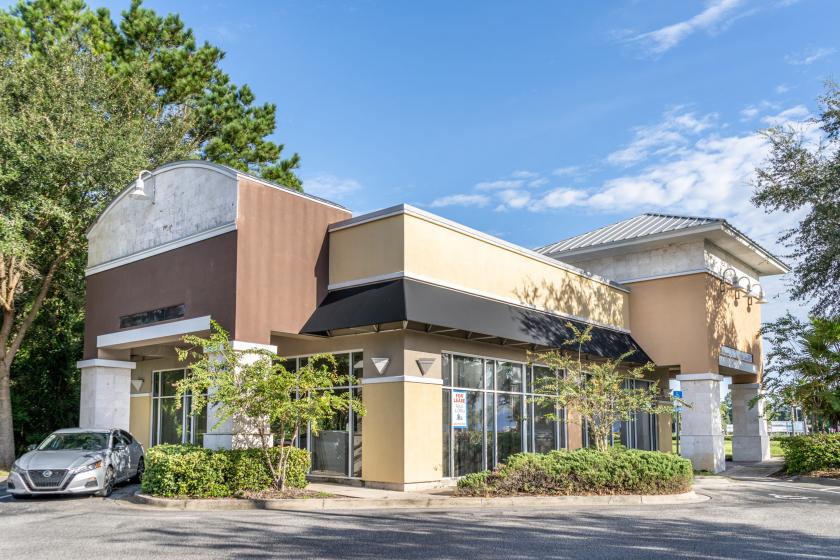
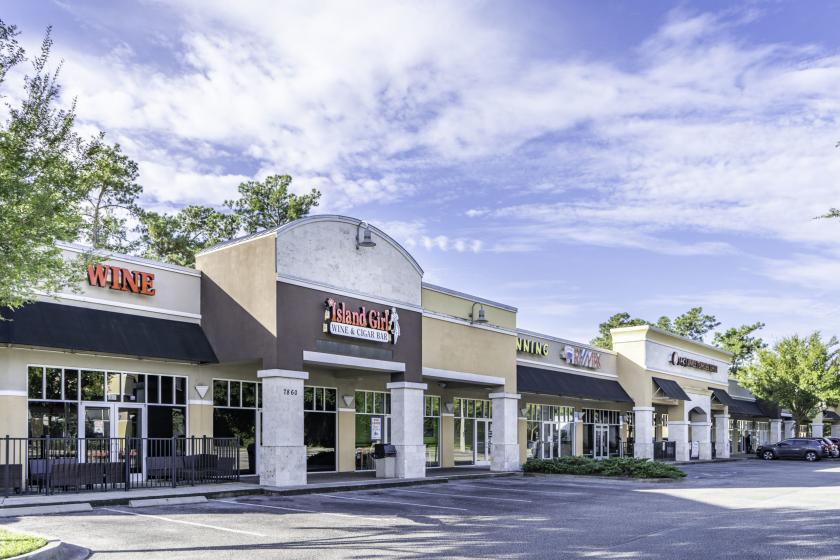
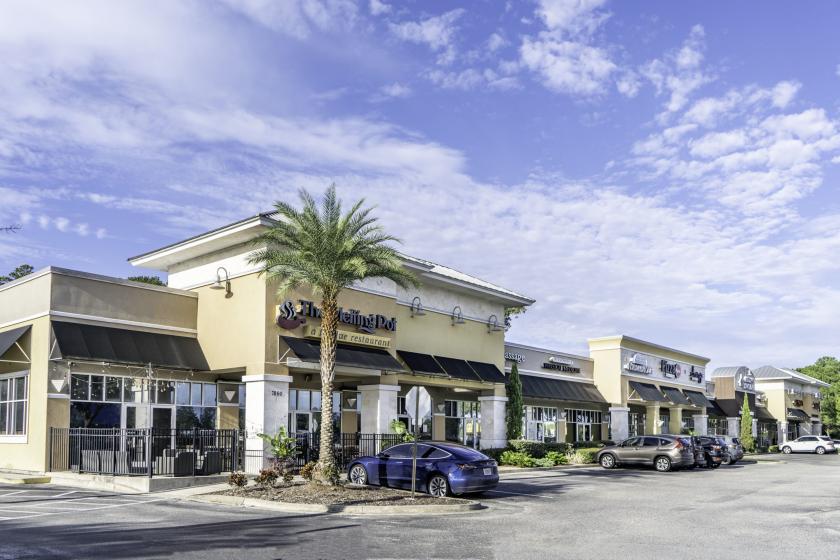
1-Mile | 3-Miles | 5-Miles | ||
---|---|---|---|---|
Total Population | 3,358 | 48,369 | 128,263 | |
Population Median Age | 38 | 35 | 37 | |
Population by Age | 0-9 Yrs | 316 (9%) | 4635 (9%) | 14510 (11%) |
10-19 Yrs | 390 (11%) | 5817 (12%) | 14139 (11%) | |
20-29 Yrs | 629 (18%) | 11533 (23%) | 24534 (19%) | |
30-39 Yrs | 456 (13%) | 8734 (18%) | 22218 (17%) | |
40-49 Yrs | 525 (15%) | 5673 (11%) | 15730 (12%) | |
50-59 Yrs | 464 (13%) | 5247 (10%) | 14874 (11%) | |
60-69 Yrs | 269 (8%) | 3662 (7%) | 11720 (9%) | |
70+ Yrs | 308 (9%) | 3068 (6%) | 10535 (8%) | |
Median HH Income | $74,419 | $64,679 | $67,109 | |
Total Household Income | < 24K | 125 (8%) | 2606 (12%) | 7196 (13%) |
25-49K | 211 (13%) | 4381 (21%) | 11397 (21%) | |
50-74K | 442 (28%) | 5037 (24%) | 10727 (20%) | |
75-99K | 264 (17%) | 3246 (15%) | 8272 (15%) | |
100-199K | 296 (19%) | 3840 (18%) | 11148 (21%) | |
200K+ | 200 (13%) | 1527 (7%) | 4051 (7%) | |
Highest Education Level | No Diploma | 74 | 1637 | 5373 |
Diploma or GED | 253 | 5042 | 16707 | |
Some College | 436 | 6329 | 17868 | |
Assoc. Degree | 218 | 3204 | 9020 | |
Bachelors Degree | 840 | 10698 | 25612 | |
Higher Degree | 548 | 5310 | 13997 | |
Total Housing Units | 1,676 | 23,377 | 59,158 | |
--Owner-Occupied | 676 | 7,103 | 24,290 | |
--Renter-Occupied | 862 | 13,533 | 28,502 | |
Owner-Occupied Values | < 100K | 15 | 816 | 2923 |
100-199K | 188 | 1916 | 7440 | |
200-299K | 127 | 1857 | 6552 | |
300-399K | 132 | 1177 | 3387 | |
400-499K | 68 | 642 | 1875 | |
500K+ | 145 | 695 | 2113 | |
Total Working Age Population | 2,781 | 41,347 | 106,305 | |
In Work Force | 1,911 | 29,932 | 74,024 | |
Not In Work Force | 870 | 11,415 | 32,281 | |
Workforce Employed | 1,861 | 28,629 | 69,919 | |
Workforce Unemployed | 30 | 893 | 2,715 | |
Civlian Workforce | 1,891 | 29,522 | 72,634 | |
Military Workforce | 20 | 410 | 1,390 | |
Total Households | 1,538 | 20,636 | 52,792 | |
Family Households | 777 | 10,334 | 29,415 | |
Non-Family Households | 761 | 10,303 | 23,378 | |
Married Couple | 655 | 7,684 | 21,840 | |
Other Family | 123 | 2,650 | 7,575 | |
Married w/Child | 225 | 2,907 | 8,465 | |
Single Male w/Child | 40 | 265 | 846 | |
Single Female w/Child | 36 | 966 | 2,905 |
Population Change Last Two Decades - Plus Projection
2000 | % | 2010 | % | 2020 | % | 2030 | |
---|---|---|---|---|---|---|---|
Florida | 15,982,378 | +18 | 18,801,310 | +14 | 21,517,610 | +13 | 24,340,457 |
Clay County | 140,814 | +36 | 190,865 | +15 | 220,221 | +16 | 255,695 |
Duval County | 778,879 | +11 | 864,263 | +14 | 981,852 | +12 | 1,095,165 |
Nassau County | 57,663 | +27 | 73,314 | +18 | 86,416 | +18 | 102,124 |
St. Johns County | 123,135 | +54 | 190,039 | +35 | 256,127 | +29 | 329,487 |
Total Working Age Population:
Total Households:
Total Working Age Population:
Total Households:
Total Working Age Population:
Total Households: