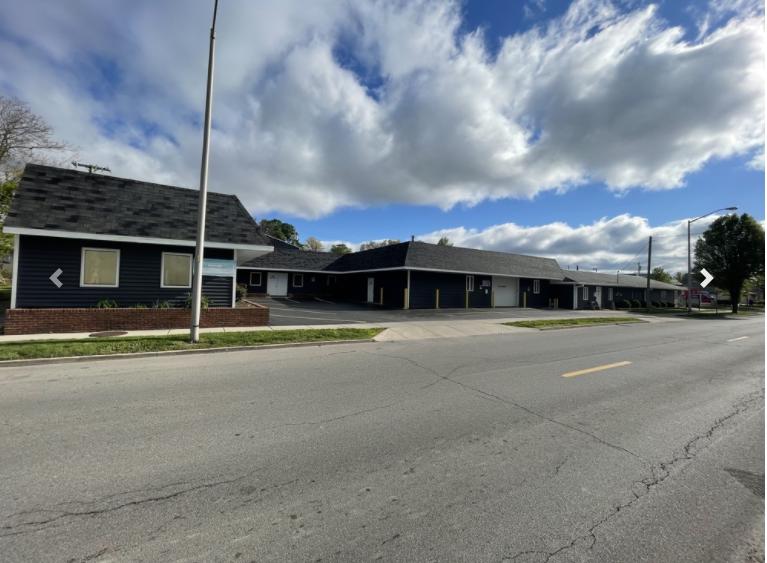
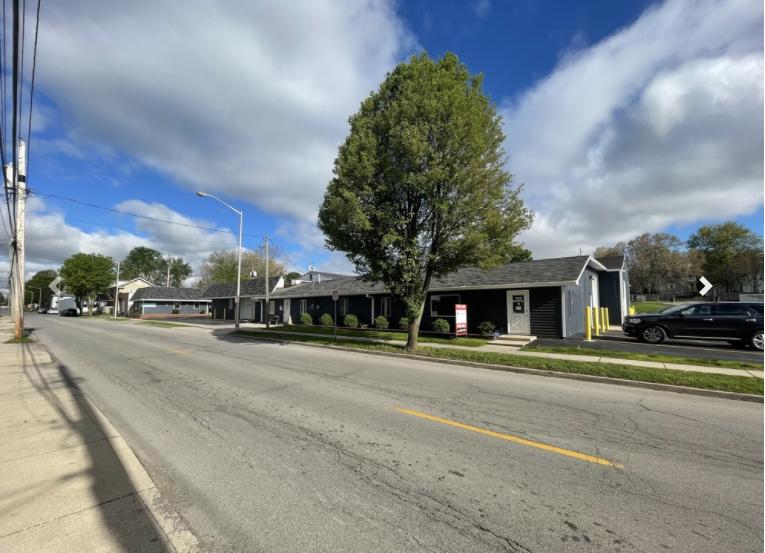
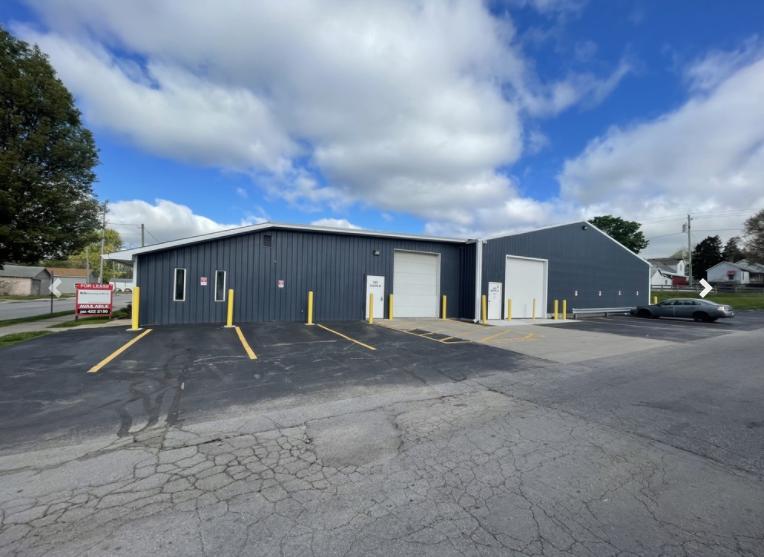
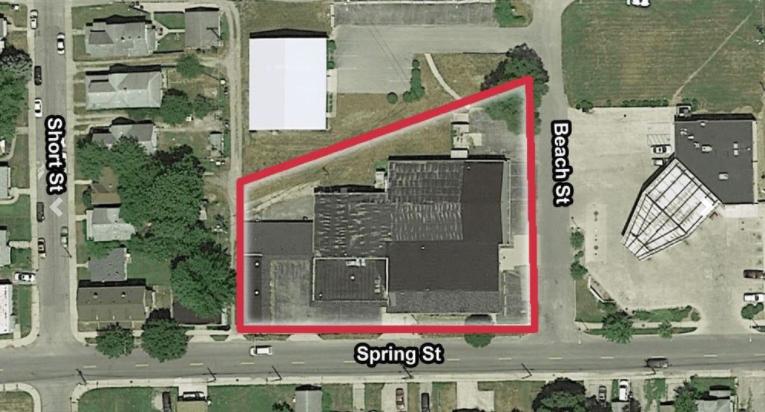
1-Mile | 3-Miles | 5-Miles | ||
---|---|---|---|---|
Total Population | 15,682 | 79,919 | 177,364 | |
Population Median Age | 35 | 35 | 36 | |
Population by Age | 0-9 Yrs | 2283 (14%) | 12064 (15%) | 26123 (14%) |
10-19 Yrs | 1621 (10%) | 11284 (14%) | 24215 (13%) | |
20-29 Yrs | 2984 (19%) | 13619 (17%) | 30490 (17%) | |
30-39 Yrs | 2332 (14%) | 11379 (14%) | 23615 (13%) | |
40-49 Yrs | 2083 (13%) | 9585 (11%) | 20457 (11%) | |
50-59 Yrs | 1839 (11%) | 9000 (11%) | 20269 (11%) | |
60-69 Yrs | 1671 (10%) | 7474 (9%) | 17747 (10%) | |
70+ Yrs | 869 (5%) | 5513 (6%) | 14448 (8%) | |
Median HH Income | $37,991 | $39,347 | $42,802 | |
Total Household Income | < 24K | 2112 (31%) | 9993 (30%) | 19602 (27%) |
25-49K | 2199 (32%) | 9922 (30%) | 21606 (30%) | |
50-74K | 1169 (17%) | 5835 (18%) | 13940 (19%) | |
75-99K | 727 (10%) | 3372 (10%) | 7997 (11%) | |
100-199K | 469 (6%) | 2713 (8%) | 7330 (10%) | |
200K+ | 79 (1%) | 443 (1%) | 992 (1%) | |
Highest Education Level | No Diploma | 1889 | 7900 | 16276 |
Diploma or GED | 3720 | 16217 | 34593 | |
Some College | 2155 | 10827 | 24599 | |
Assoc. Degree | 817 | 4583 | 11391 | |
Bachelors Degree | 1257 | 7002 | 17416 | |
Higher Degree | 567 | 3501 | 7916 | |
Total Housing Units | 7,702 | 37,271 | 80,287 | |
--Owner-Occupied | 2,930 | 16,376 | 39,437 | |
--Renter-Occupied | 3,826 | 15,902 | 32,031 | |
Owner-Occupied Values | < 100K | 2396 | 11058 | 22028 |
100-199K | 398 | 4355 | 14908 | |
200-299K | 66 | 614 | 1542 | |
300-399K | 23 | 130 | 454 | |
400-499K | 24 | 90 | 179 | |
500K+ | 23 | 128 | 326 | |
Total Working Age Population | 12,455 | 61,153 | 136,401 | |
In Work Force | 7,931 | 40,624 | 90,371 | |
Not In Work Force | 4,525 | 20,529 | 46,030 | |
Workforce Employed | 7,581 | 38,141 | 84,648 | |
Workforce Unemployed | 350 | 2,467 | 5,677 | |
Civlian Workforce | 7,931 | 40,608 | 90,325 | |
Military Workforce | 0 | 16 | 46 | |
Total Households | 6,755 | 32,278 | 71,468 | |
Family Households | 3,134 | 17,374 | 40,781 | |
Non-Family Households | 3,621 | 14,903 | 30,687 | |
Married Couple | 1,907 | 10,115 | 24,970 | |
Other Family | 1,227 | 7,259 | 15,811 | |
Married w/Child | 846 | 4,381 | 10,272 | |
Single Male w/Child | 191 | 1,063 | 2,375 | |
Single Female w/Child | 536 | 3,651 | 7,442 |
Population Change Last Two Decades - Plus Projection
2000 | % | 2010 | % | 2020 | % | 2030 | |
---|---|---|---|---|---|---|---|
Indiana | 6,080,485 | +7 | 6,483,802 | +4 | 6,738,573 | +4 | 7,014,880 |
Allen County | 331,849 | +7 | 355,329 | +7 | 379,671 | +6 | 402,948 |
Total Working Age Population:
Total Households:
Total Working Age Population:
Total Households:
Total Working Age Population:
Total Households: