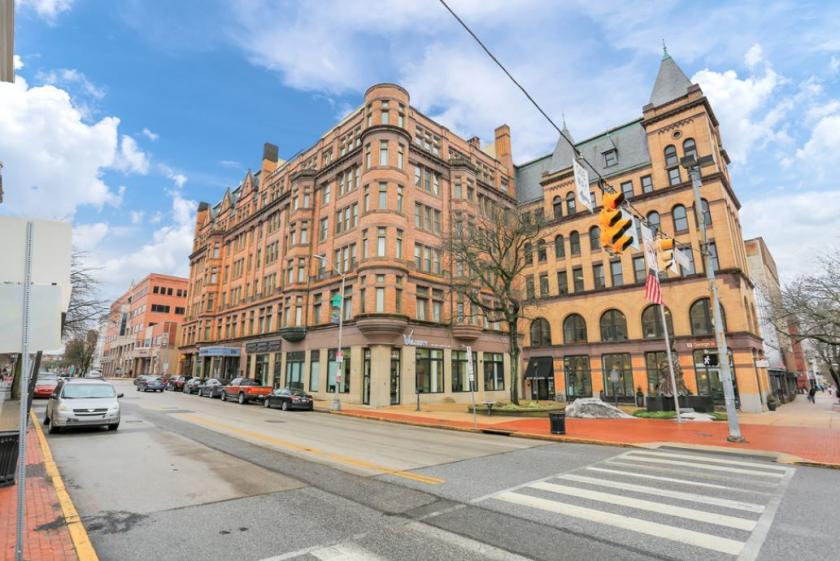
1-Mile | 3-Miles | 5-Miles | ||
---|---|---|---|---|
Total Population | 29,905 | 87,713 | 148,117 | |
Population Median Age | 33 | 37 | 39 | |
Population by Age | 0-9 Yrs | 4887 (16%) | 11267 (12%) | 17840 (12%) |
10-19 Yrs | 4763 (15%) | 12904 (14%) | 20497 (13%) | |
20-29 Yrs | 5253 (17%) | 13249 (15%) | 20690 (13%) | |
30-39 Yrs | 4202 (14%) | 11421 (13%) | 18696 (12%) | |
40-49 Yrs | 3610 (12%) | 10908 (12%) | 18386 (12%) | |
50-59 Yrs | 3392 (11%) | 10652 (12%) | 18907 (12%) | |
60-69 Yrs | 2351 (7%) | 8882 (10%) | 16429 (11%) | |
70+ Yrs | 1447 (4%) | 8430 (9%) | 16672 (11%) | |
Median HH Income | $29,921 | $46,671 | $55,792 | |
Total Household Income | < 24K | 4462 (40%) | 9109 (26%) | 12467 (22%) |
25-49K | 3339 (30%) | 8795 (25%) | 13047 (23%) | |
50-74K | 1786 (16%) | 6554 (19%) | 10755 (19%) | |
75-99K | 673 (6%) | 3684 (10%) | 6877 (12%) | |
100-199K | 635 (5%) | 4766 (14%) | 10966 (19%) | |
200K+ | 91 (0%) | 933 (2%) | 2411 (4%) | |
Highest Education Level | No Diploma | 4380 | 8797 | 12409 |
Diploma or GED | 7270 | 22190 | 37322 | |
Some College | 2298 | 8402 | 14779 | |
Assoc. Degree | 1280 | 5100 | 9459 | |
Bachelors Degree | 1448 | 7172 | 15414 | |
Higher Degree | 650 | 4547 | 9457 | |
Total Housing Units | 12,773 | 37,535 | 61,012 | |
--Owner-Occupied | 3,390 | 18,298 | 35,808 | |
--Renter-Occupied | 7,595 | 15,544 | 20,715 | |
Owner-Occupied Values | < 100K | 2565 | 6209 | 7601 |
100-199K | 593 | 8510 | 16684 | |
200-299K | 171 | 2308 | 7039 | |
300-399K | 29 | 646 | 2750 | |
400-499K | 28 | 265 | 887 | |
500K+ | 5 | 360 | 846 | |
Total Working Age Population | 22,242 | 69,652 | 118,997 | |
In Work Force | 13,346 | 43,711 | 73,721 | |
Not In Work Force | 8,896 | 25,941 | 45,276 | |
Workforce Employed | 11,736 | 40,161 | 69,244 | |
Workforce Unemployed | 1,588 | 3,512 | 4,398 | |
Civlian Workforce | 13,324 | 43,673 | 73,641 | |
Military Workforce | 22 | 38 | 79 | |
Total Households | 10,985 | 33,842 | 56,523 | |
Family Households | 6,215 | 20,055 | 35,658 | |
Non-Family Households | 4,770 | 13,787 | 20,865 | |
Married Couple | 2,542 | 11,883 | 24,352 | |
Other Family | 3,674 | 8,172 | 11,306 | |
Married w/Child | 1,136 | 4,493 | 9,083 | |
Single Male w/Child | 460 | 1,066 | 1,400 | |
Single Female w/Child | 1,915 | 3,998 | 5,310 |
Population Change Last Two Decades - Plus Projection
2000 | % | 2010 | % | 2020 | % | 2030 | |
---|---|---|---|---|---|---|---|
Pennsylvania | 12,281,054 | +3 | 12,702,379 | +4 | 13,230,170 | +4 | 13,759,594 |
Lancaster County | 470,658 | +10 | 519,445 | +8 | 559,247 | +8 | 602,153 |
York County | 381,751 | +14 | 434,972 | +6 | 460,514 | +5 | 484,497 |
Total Working Age Population:
Total Households:
Total Working Age Population:
Total Households:
Total Working Age Population:
Total Households: