Flex-Office-Warehouse
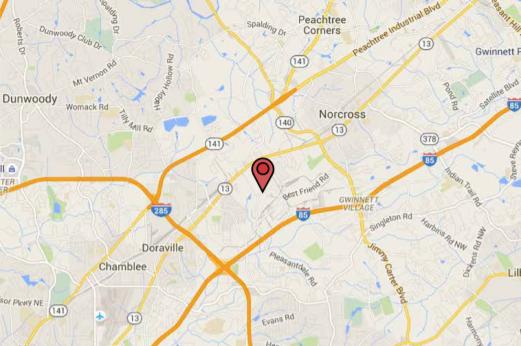
2395 Pleasantdale Road Atlanta, GA 30340
2395 Pleasantdale Road Atlanta, GA 30340
Details & Description
Property Highlights
• Interchange Business Center
• Flex Space Available
Listing Agents

Mark Verryth
O: 404-812-4034
M: 470-585-2766
mverryth@naibg.com
O: 404-812-4034
M: 470-585-2766
mverryth@naibg.com
While we strive to provide the most accurate information, all listing information, and demographic data, is provided by third-parties. As such, MyEListing will not be responsible for the accuracy of the information. It is strongly recommended that you verify all information with the listing agent, and any relevant agencies, prior to making any decisions.


