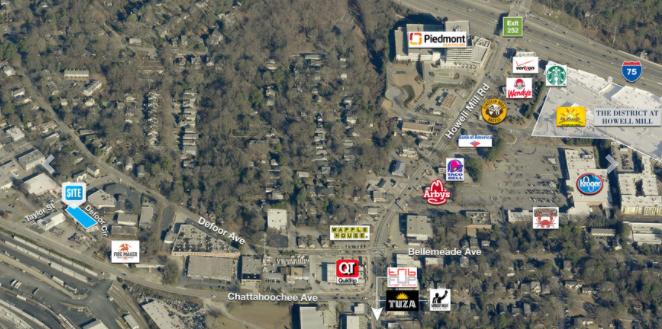
Flex-Office-Warehouse
1676 Defoor Circle Northwest Atlanta, GA 30318
1676 Defoor Circle Northwest Atlanta, GA 30318
Details & Description
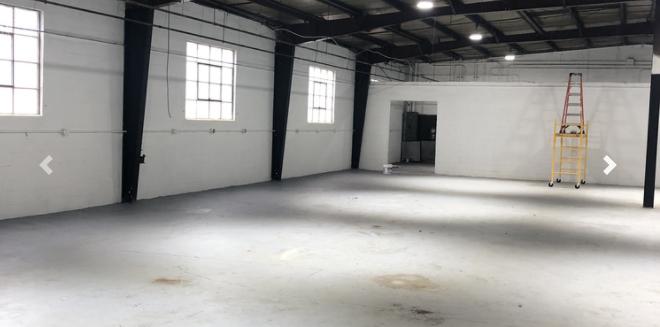
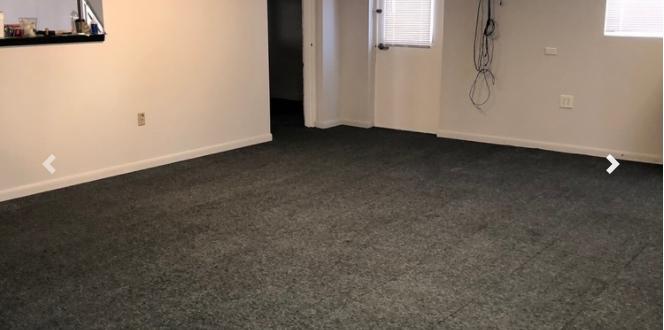
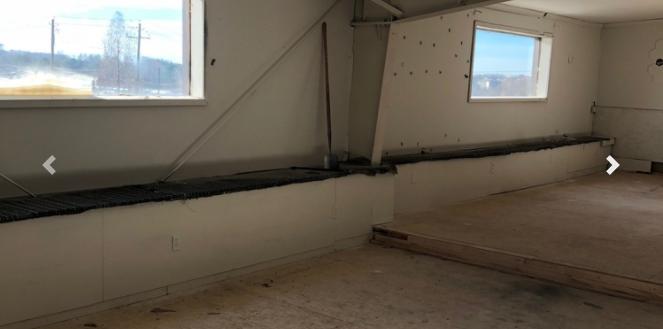
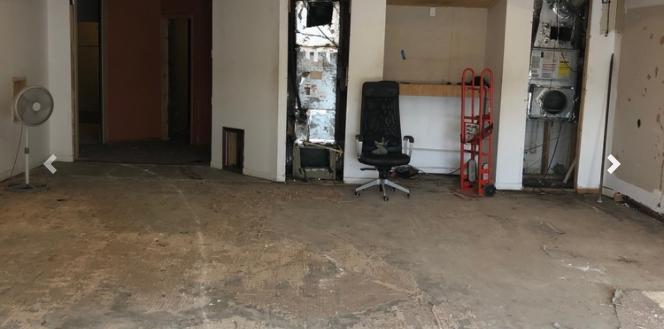
Additional Photos
Listing Agents

Steven Marshall
O: 404-812-4005
smarshall@naibg.com
O: 404-812-4005
smarshall@naibg.com
While we strive to provide the most accurate information, all listing information, and demographic data, is provided by third-parties. As such, MyEListing will not be responsible for the accuracy of the information. It is strongly recommended that you verify all information with the listing agent, and any relevant agencies, prior to making any decisions.


