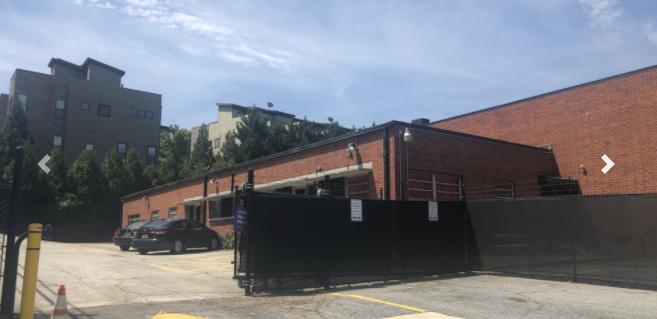
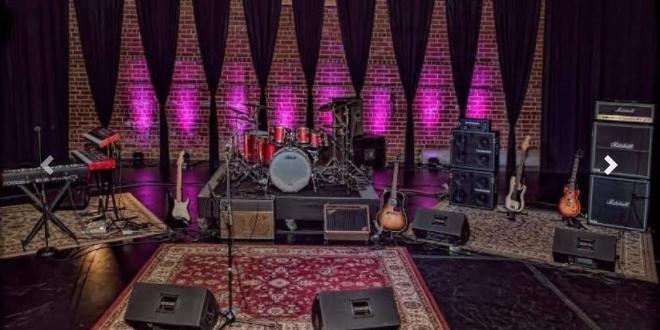
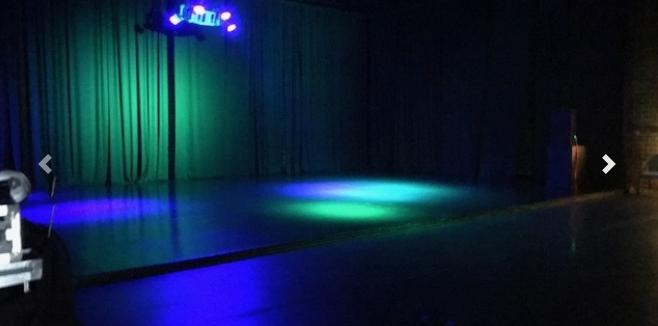
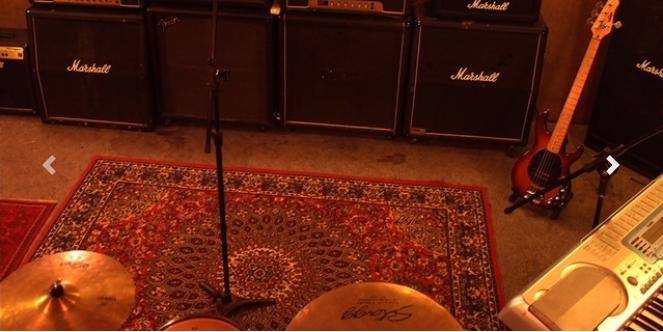
Recording/Rehearsal/Film Production & Events Facility
Also Ideal for Office/Flex Conversion
Located by the future Westside Atlanta Beltline Trail & 6 Blocks from the new Westside Reservoir Park
Walk to Restaurants, Top Golf, Townhomes, Apartments
Owner Financing Possible
20,000 SF Total on 1 Acre Lot
Highlights
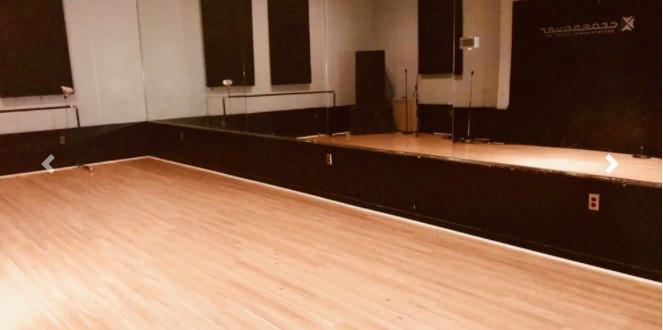
Recording/Rehearsal/Film Production & Events Facility
Also Ideal for Office/Flex Conversion
Located by the future Westside Atlanta Beltline Trail & 6 Blocks from the new Westside Reservoir Park
Walk to Restaurants, Top Golf, Townhomes, Apartments
Owner Financing Possible
20,000 SF Total on 1 Acre Lot
No part of this information may be copied, reproduced, repurposed, or screen-captured for any commercial purpose without prior written authorization from MyEListing.
While we strive to provide the most accurate information, all listing information, and demographic data, is provided by third-parties. As such, MyEListing will not be responsible for the accuracy of the information. It is strongly recommended that you verify all information with the listing agent, and any relevant agencies, prior to making any decisions.
What is the building size of this Flex/Office Whs property in Atlanta, GA?
The size of the building/unit at 1310 Ellsworth Industrial Boulevard Northwest in Atlanta is 20,000 square feet
How much land does the Atlanta, GA property at 1310 Ellsworth Industrial Boulevard Northwest include?
1310 Ellsworth Industrial Boulevard Northwest in Atlanta includes 1.000 acres of land
What is the population within 1 mile of 1310 Ellsworth Industrial Boulevard Northwest in Atlanta?
The population within 1 mile of 1310 Ellsworth Industrial Boulevard Northwest Atlanta, GA 30318 is 8,928 people.
Who do I contact for questions about 1310 Ellsworth Industrial Boulevard Northwest?
You should contact the listing agent,
Steven Marshall, for any details regarding this commercial listing.