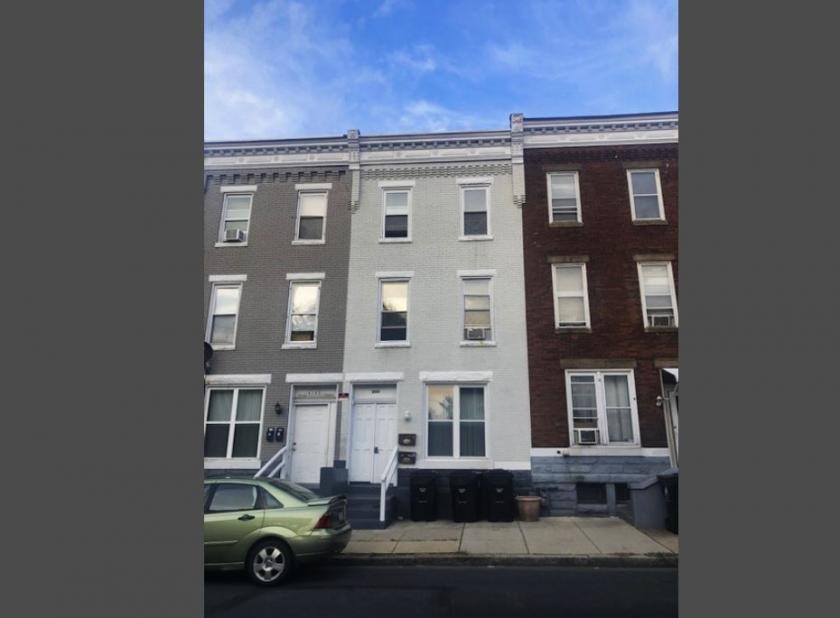
Multifamily Housing
1414 Regina Street Harrisburg, PA 17103
1414 Regina Street Harrisburg, PA 17103
Details & Description
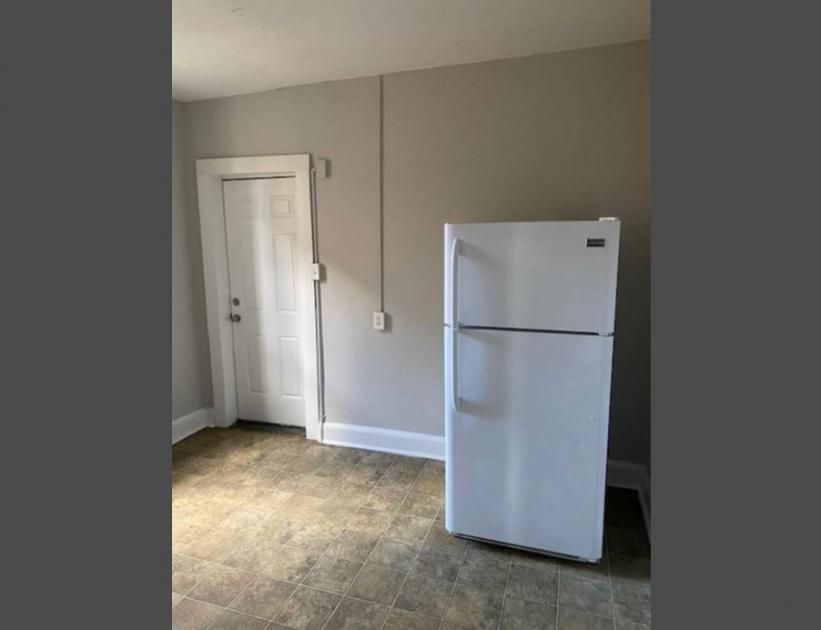
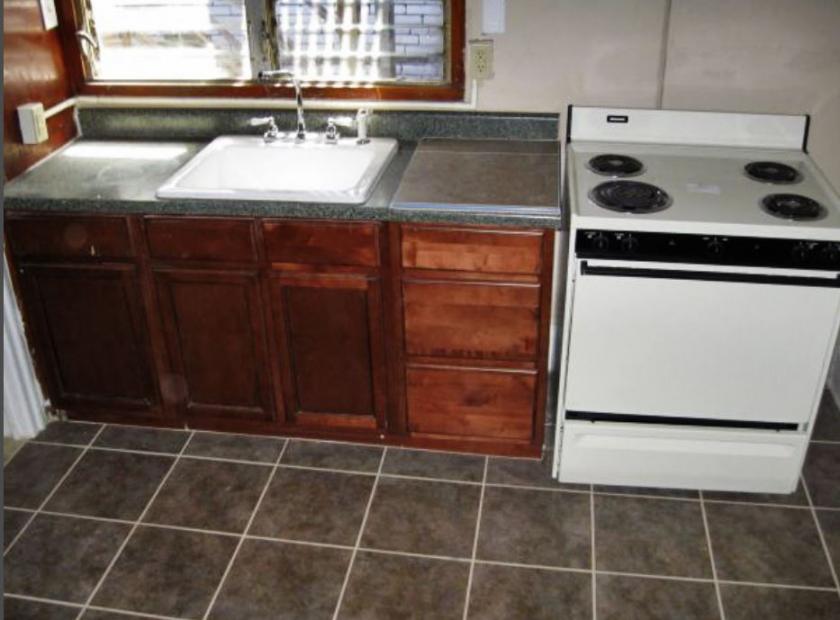
Additional Photos


Listing Agents

Peter Higgins
O: 717-761-5070
M: 717-319-7666
phiggins@naicir.com
O: 717-761-5070
M: 717-319-7666
phiggins@naicir.com
While we strive to provide the most accurate information, all listing information, and demographic data, is provided by third-parties. As such, MyEListing will not be responsible for the accuracy of the information. It is strongly recommended that you verify all information with the listing agent, and any relevant agencies, prior to making any decisions.


