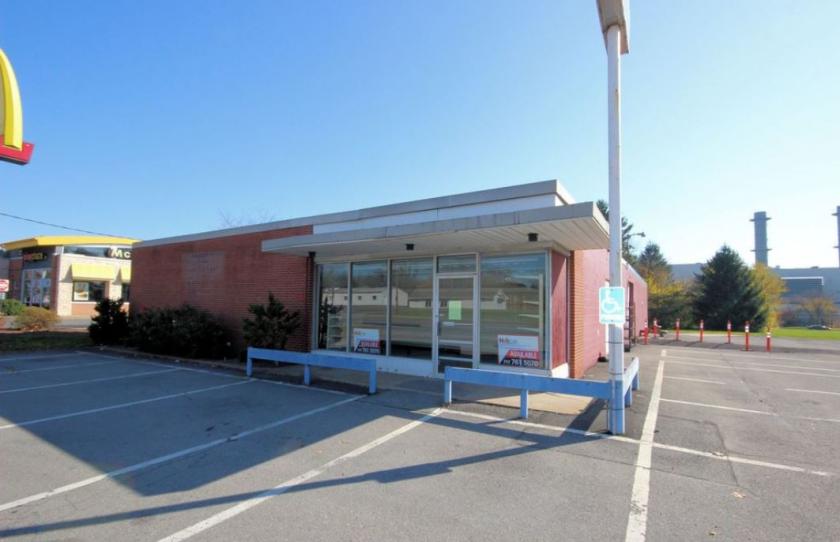
Retail Space
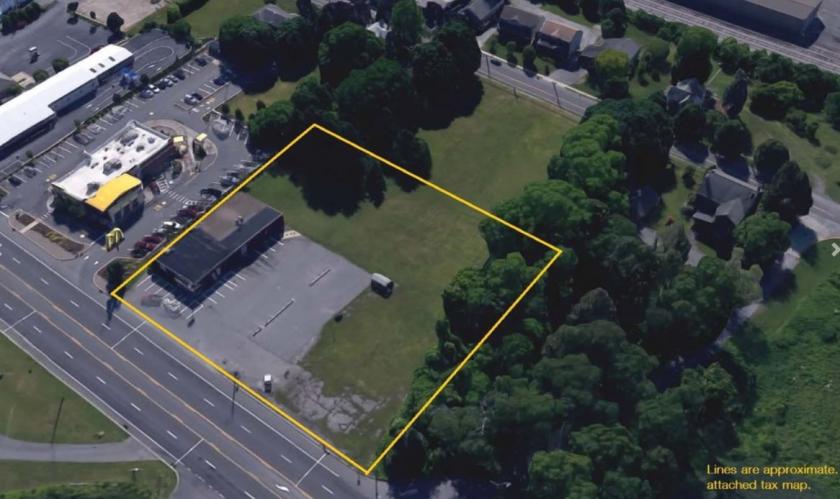
2558 North Susquehanna Trail Selinsgrove, PA 17870
2558 North Susquehanna Trail Selinsgrove, PA 17870
Details & Description
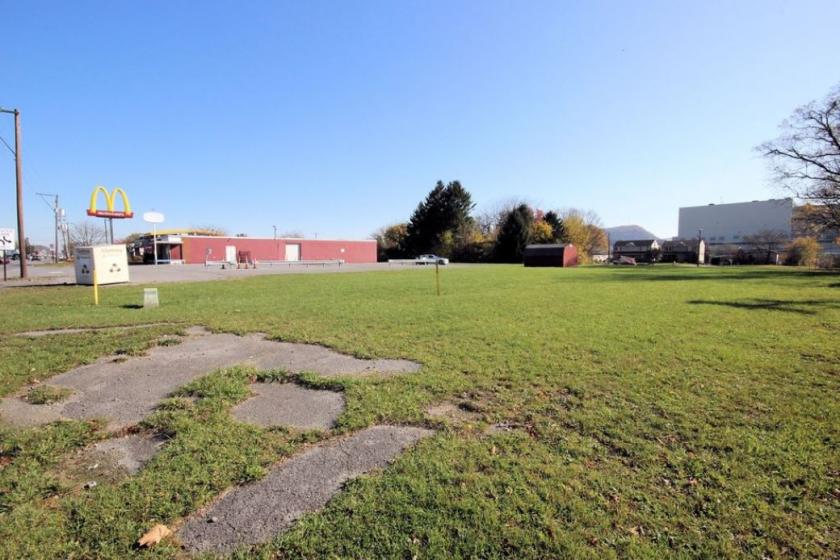
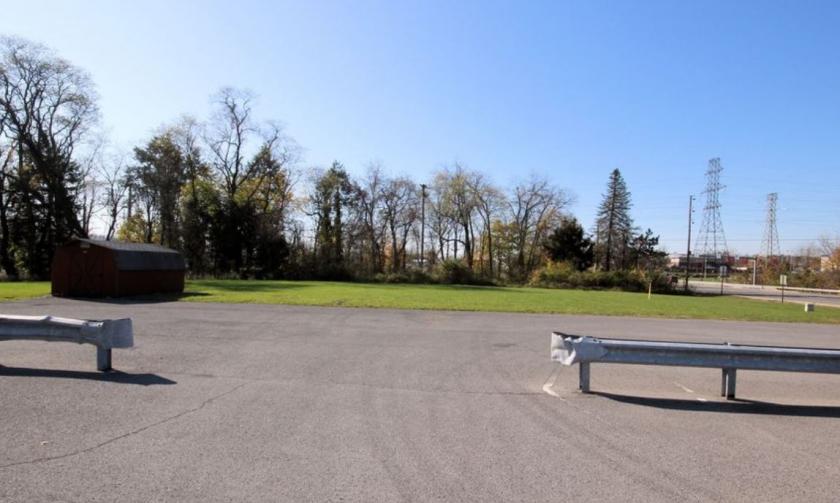
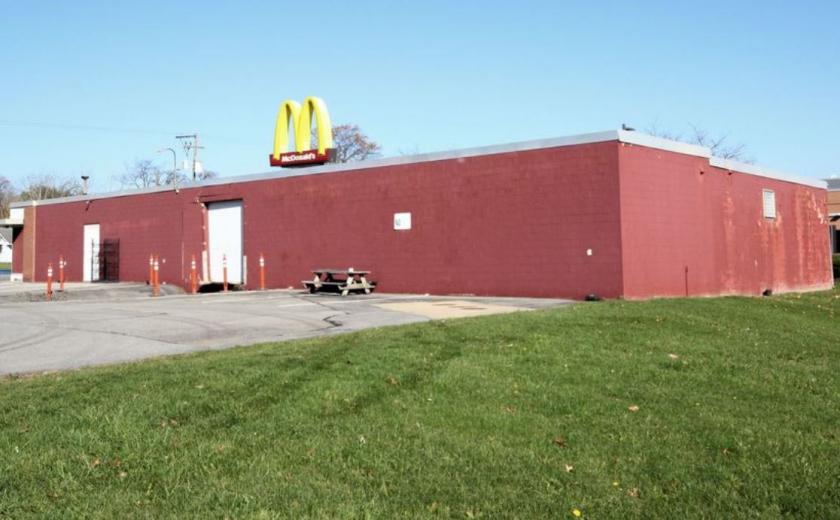
Additional Photos
Listing Agents

Daniel Alderman
O: 717761507013
M: 717-579-2052
dalderman@naicir.com
O: 717761507013
M: 717-579-2052
dalderman@naicir.com
While we strive to provide the most accurate information, all listing information, and demographic data, is provided by third-parties. As such, MyEListing will not be responsible for the accuracy of the information. It is strongly recommended that you verify all information with the listing agent, and any relevant agencies, prior to making any decisions.


