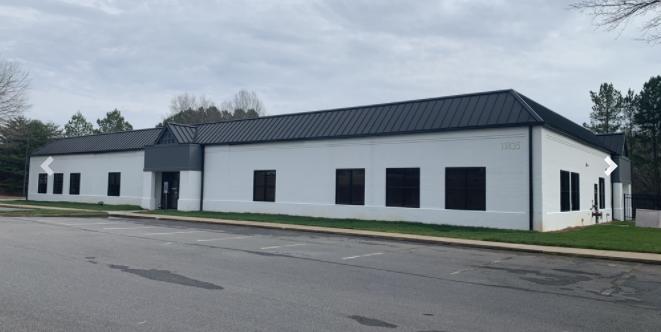
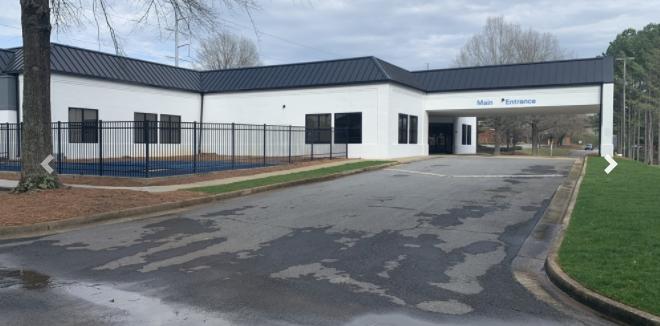
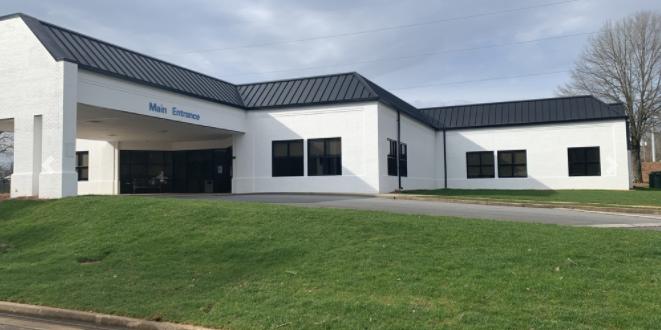
1-Mile | 3-Miles | 5-Miles | ||
---|---|---|---|---|
Total Population | 6,131 | 65,797 | 177,253 | |
Population Median Age | 37 | 37 | 37 | |
Population by Age | 0-9 Yrs | 925 (15%) | 9009 (13%) | 24183 (13%) |
10-19 Yrs | 915 (14%) | 9331 (14%) | 25327 (14%) | |
20-29 Yrs | 506 (8%) | 6869 (10%) | 17823 (10%) | |
30-39 Yrs | 1028 (16%) | 9933 (15%) | 26936 (15%) | |
40-49 Yrs | 907 (14%) | 10226 (15%) | 27016 (15%) | |
50-59 Yrs | 688 (11%) | 8956 (13%) | 26352 (14%) | |
60-69 Yrs | 554 (9%) | 6602 (10%) | 17650 (9%) | |
70+ Yrs | 607 (9%) | 4873 (7%) | 11965 (6%) | |
Median HH Income | $72,315 | $91,939 | $99,186 | |
Total Household Income | < 24K | 148 (6%) | 2057 (8%) | 5632 (8%) |
25-49K | 546 (24%) | 4443 (18%) | 10153 (15%) | |
50-74K | 443 (20%) | 3798 (15%) | 9531 (14%) | |
75-99K | 297 (13%) | 2703 (11%) | 7621 (11%) | |
100-199K | 531 (24%) | 7285 (30%) | 19642 (30%) | |
200K+ | 231 (10%) | 3972 (16%) | 12799 (19%) | |
Highest Education Level | No Diploma | 220 | 3472 | 6601 |
Diploma or GED | 809 | 6116 | 14136 | |
Some College | 863 | 6783 | 18232 | |
Assoc. Degree | 221 | 2518 | 6854 | |
Bachelors Degree | 1286 | 15970 | 45818 | |
Higher Degree | 742 | 9779 | 28328 | |
Total Housing Units | 2,376 | 25,837 | 69,812 | |
--Owner-Occupied | 1,197 | 14,186 | 42,719 | |
--Renter-Occupied | 1,000 | 10,071 | 22,659 | |
Owner-Occupied Values | < 100K | 35 | 373 | 1303 |
100-199K | 285 | 1957 | 4697 | |
200-299K | 343 | 2921 | 8035 | |
300-399K | 257 | 3459 | 10057 | |
400-499K | 154 | 2311 | 7096 | |
500K+ | 122 | 3166 | 11531 | |
Total Working Age Population | 4,633 | 51,013 | 137,156 | |
In Work Force | 3,312 | 36,496 | 98,019 | |
Not In Work Force | 1,321 | 14,516 | 39,137 | |
Workforce Employed | 3,194 | 35,115 | 94,178 | |
Workforce Unemployed | 118 | 1,347 | 3,708 | |
Civlian Workforce | 3,312 | 36,462 | 97,885 | |
Military Workforce | 0 | 34 | 133 | |
Total Households | 2,197 | 24,258 | 65,378 | |
Family Households | 1,373 | 16,303 | 45,149 | |
Non-Family Households | 824 | 7,955 | 20,230 | |
Married Couple | 1,017 | 12,650 | 36,564 | |
Other Family | 356 | 3,653 | 8,584 | |
Married w/Child | 519 | 6,401 | 18,713 | |
Single Male w/Child | 24 | 603 | 1,289 | |
Single Female w/Child | 253 | 1,620 | 3,884 |
Population Change Last Two Decades - Plus Projection
2000 | % | 2010 | % | 2020 | % | 2030 | |
---|---|---|---|---|---|---|---|
Georgia | 8,186,453 | +18 | 9,687,653 | +12 | 10,833,472 | +13 | 12,292,423 |
Cherokee County | 141,903 | +51 | 214,346 | +24 | 266,617 | +20 | 320,849 |
Cobb County | 607,751 | +13 | 688,078 | +15 | 790,588 | +19 | 938,747 |
Forsyth County | 98,407 | +78 | 175,511 | +44 | 252,507 | +35 | 341,646 |
Fulton County | 816,006 | +13 | 920,581 | +19 | 1,099,181 | +18 | 1,300,861 |
Gwinnett County | 588,448 | +37 | 805,321 | +21 | 971,145 | +21 | 1,175,358 |
Total Working Age Population:
Total Households:
Total Working Age Population:
Total Households:
Total Working Age Population:
Total Households: