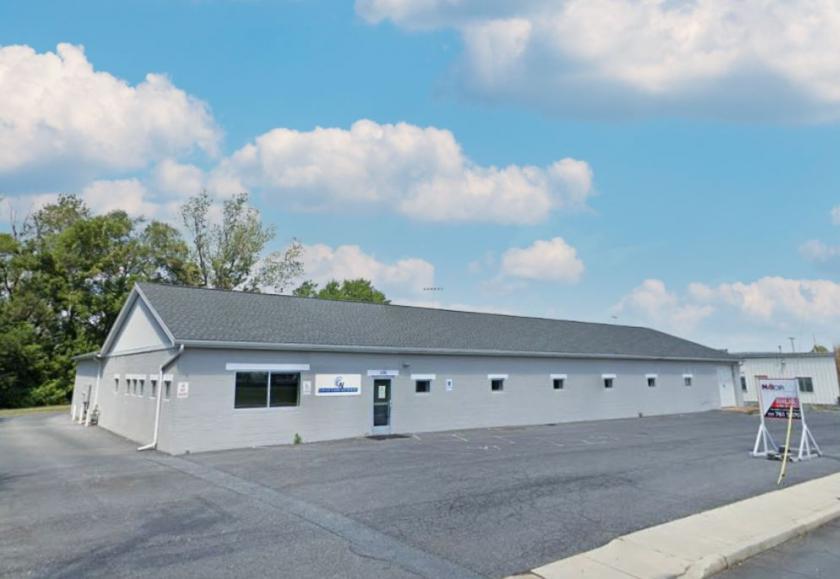
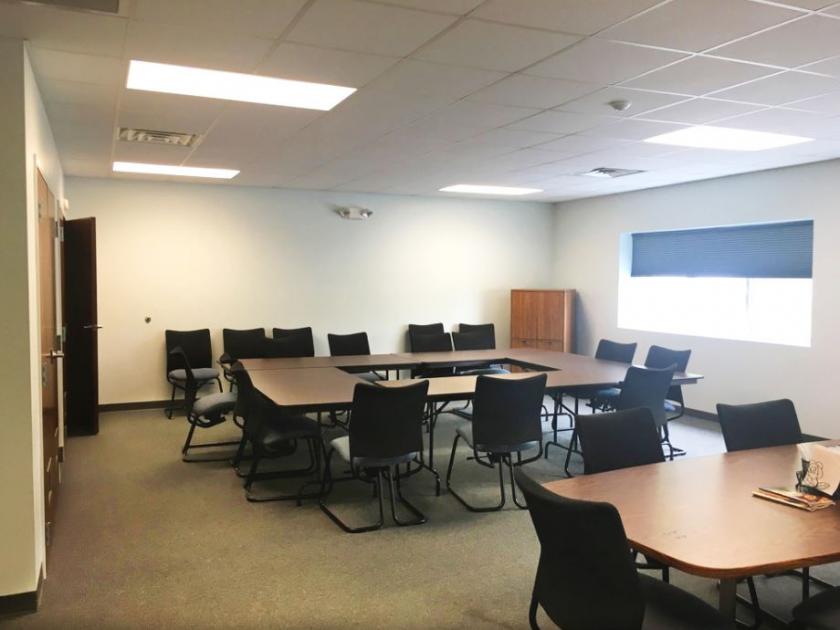
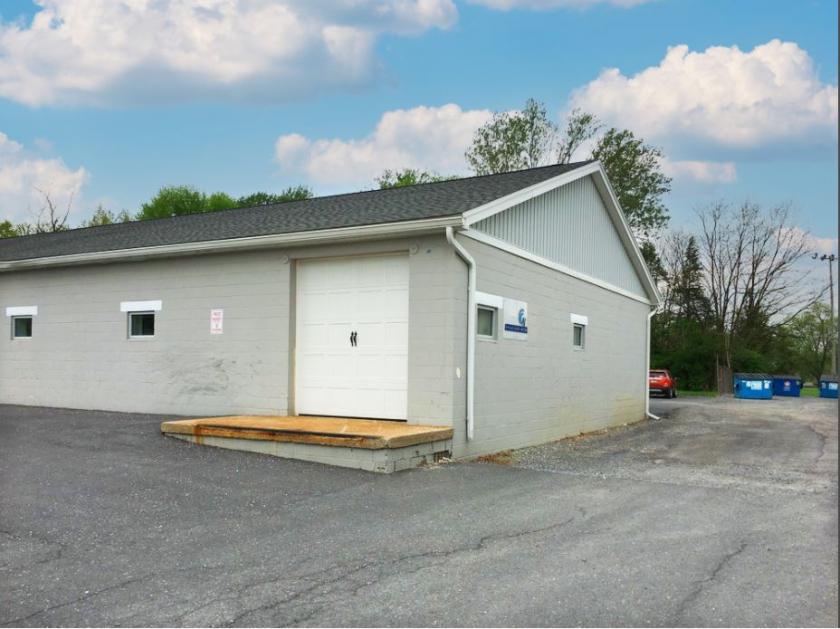
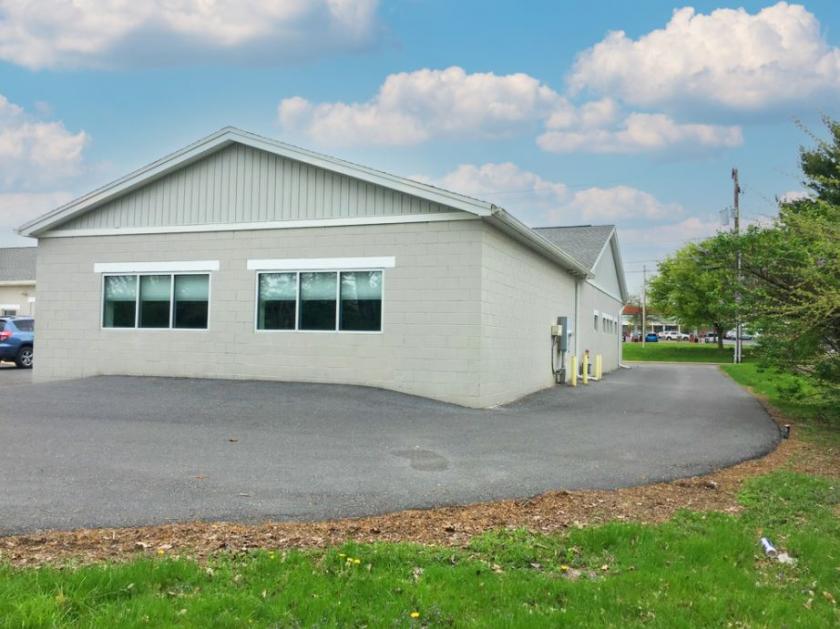
1-Mile | 3-Miles | 5-Miles | ||
---|---|---|---|---|
Total Population | 11,384 | 32,122 | 48,947 | |
Population Median Age | 36 | 39 | 40 | |
Population by Age | 0-9 Yrs | 1524 (13%) | 3777 (11%) | 5501 (11%) |
10-19 Yrs | 1753 (15%) | 4669 (14%) | 6413 (13%) | |
20-29 Yrs | 2123 (18%) | 4871 (15%) | 6627 (13%) | |
30-39 Yrs | 1350 (11%) | 3692 (11%) | 5708 (11%) | |
40-49 Yrs | 1313 (11%) | 3739 (11%) | 5622 (11%) | |
50-59 Yrs | 1245 (10%) | 3980 (12%) | 6719 (13%) | |
60-69 Yrs | 942 (8%) | 3361 (10%) | 5906 (12%) | |
70+ Yrs | 1134 (9%) | 4034 (12%) | 6452 (13%) | |
Median HH Income | $42,775 | $58,677 | $64,779 | |
Total Household Income | < 24K | 1276 (27%) | 2221 (17%) | 2824 (14%) |
25-49K | 1296 (28%) | 3058 (24%) | 4445 (23%) | |
50-74K | 694 (15%) | 2250 (17%) | 3617 (18%) | |
75-99K | 492 (10%) | 1772 (14%) | 2687 (13%) | |
100-199K | 756 (16%) | 2735 (21%) | 4633 (24%) | |
200K+ | 111 (2%) | 499 (3%) | 1032 (5%) | |
Highest Education Level | No Diploma | 682 | 1788 | 2577 |
Diploma or GED | 2335 | 6664 | 11016 | |
Some College | 1029 | 3391 | 5567 | |
Assoc. Degree | 385 | 1472 | 2496 | |
Bachelors Degree | 1361 | 4409 | 6852 | |
Higher Degree | 1256 | 3569 | 5340 | |
Total Housing Units | 4,998 | 13,426 | 20,473 | |
--Owner-Occupied | 1,444 | 7,039 | 12,463 | |
--Renter-Occupied | 3,180 | 5,496 | 6,776 | |
Owner-Occupied Values | < 100K | 267 | 711 | 1330 |
100-199K | 662 | 3126 | 5003 | |
200-299K | 399 | 2128 | 3717 | |
300-399K | 52 | 587 | 1372 | |
400-499K | 19 | 241 | 494 | |
500K+ | 45 | 247 | 547 | |
Total Working Age Population | 9,096 | 26,008 | 40,045 | |
In Work Force | 5,670 | 16,351 | 25,211 | |
Not In Work Force | 3,426 | 9,657 | 14,835 | |
Workforce Employed | 5,136 | 15,182 | 23,810 | |
Workforce Unemployed | 304 | 758 | 933 | |
Civlian Workforce | 5,440 | 15,940 | 24,743 | |
Military Workforce | 230 | 411 | 468 | |
Total Households | 4,625 | 12,535 | 19,239 | |
Family Households | 2,284 | 7,613 | 12,221 | |
Non-Family Households | 2,340 | 4,922 | 7,018 | |
Married Couple | 1,520 | 5,864 | 9,619 | |
Other Family | 765 | 1,748 | 2,602 | |
Married w/Child | 655 | 2,191 | 3,331 | |
Single Male w/Child | 130 | 229 | 360 | |
Single Female w/Child | 483 | 889 | 1,144 |
Population Change Last Two Decades - Plus Projection
2000 | % | 2010 | % | 2020 | % | 2030 | |
---|---|---|---|---|---|---|---|
Pennsylvania | 12,281,054 | +3 | 12,702,379 | +4 | 13,230,170 | +4 | 13,759,594 |
Cumberland County | 213,674 | +10 | 235,406 | +7 | 251,836 | +6 | 268,063 |
Juniata County | 22,821 | +8 | 24,636 | 0 | 24,681 | +1 | 25,013 |
Perry County | 43,602 | +5 | 45,969 | +6 | 48,597 | +4 | 50,348 |
York County | 381,751 | +14 | 434,972 | +6 | 460,514 | +5 | 484,497 |
Total Working Age Population:
Total Households:
Total Working Age Population:
Total Households:
Total Working Age Population:
Total Households: