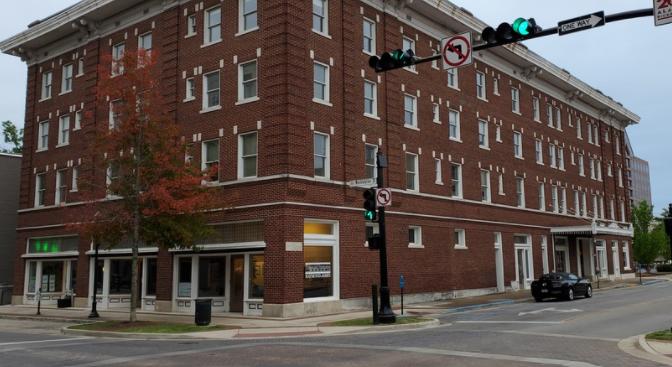
The historic Yarbrough office building, a first class boutique office building listed on the National Register of Historic Places. The boutique building consists of approximately 43,670 SF, located at the southwest corner of Washington and Holmes Street, with direct access to the only I-565 interchange accessing the downtown area, which provides ready access from the Huntsville International Airport and major surroundings. The interstate system provides ready access from areas such as Nashville, Tennessee and Louisville, Kentucky to the North, and Birmingham and Montgomery to the south.
A historic building in Huntsville, Alabama. The four-story structure and full basement was built of brick and reinforced concrete in 1922–1925. It is significant for its history as one of Huntsville's premier hotels during the 1920s, and as being a major structure designed in the popular Commercial Brick style.
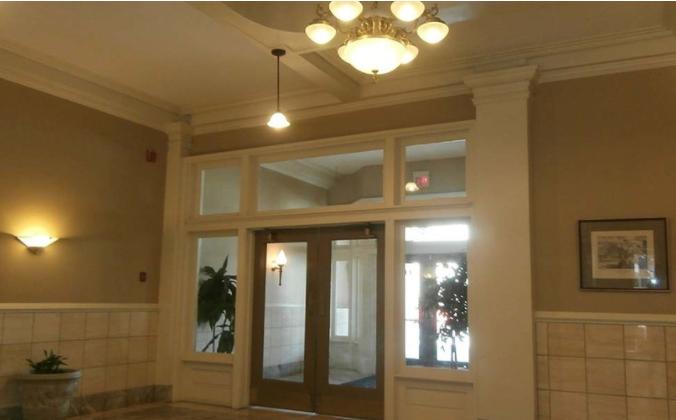
The top three floors contain 75 rooms, while the ground floor features the lobby and storefronts. Yarbrough operated as a residential hotel until the late 1950s, and was renovated in the 1980s as an office.
This premier office building is ideally located right in the middle of the downtown “core” revitalization, with major mixed use apartment complexes such as Belk Hudson and “The Avenue” a $30 million apartment complex flanking both side of the project.
Yarbrough is pedestrian friendly and is within walking distance to Huntsville’s Downtown restaurants, pubs, Big Springs International Park and Von Braun Civic Center, the Medical District and convenient access to all parts of the city.
Highlights
Unique space, with historic charm
Located in HSV Downtown Core
Pedestrian friendly
Within walking distance to Huntsville's downtown restaurants, pubs, Big Spring Park, and Von Braun Center