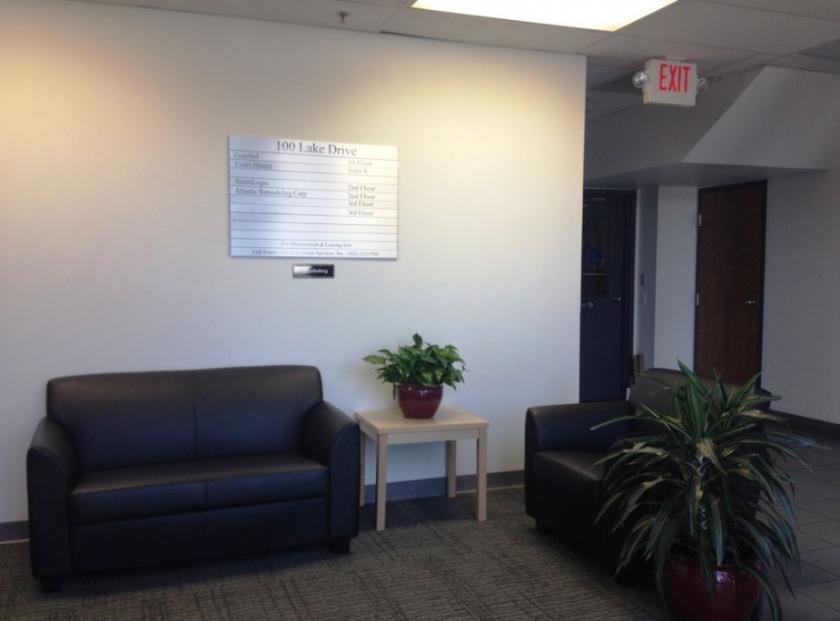
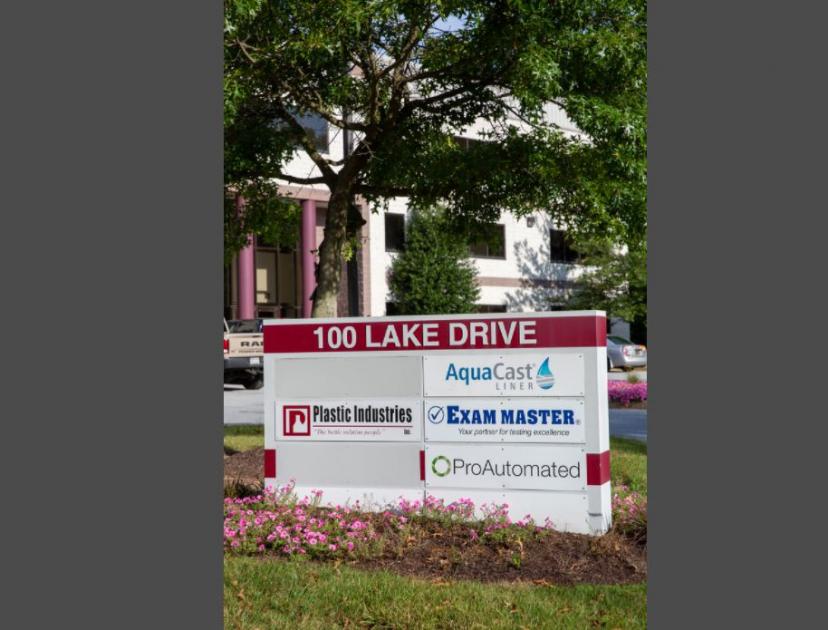
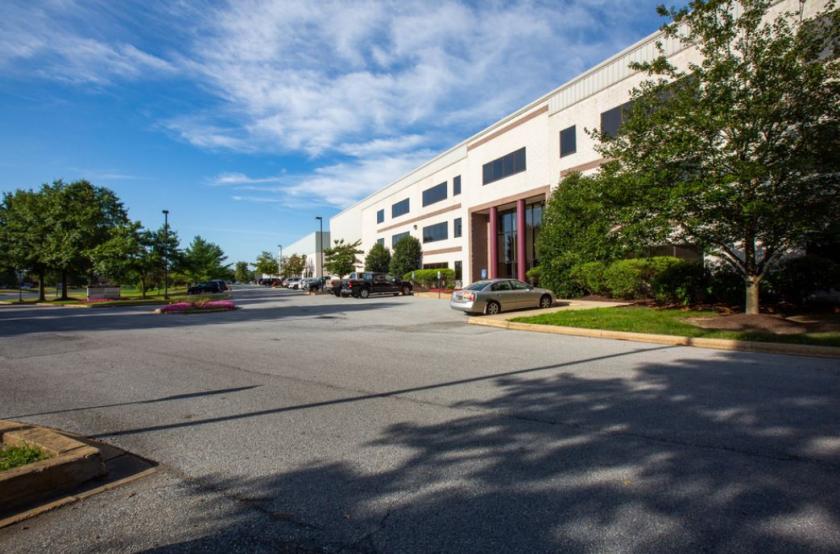
1-Mile | 3-Miles | 5-Miles | ||
---|---|---|---|---|
Total Population | 5,856 | 44,501 | 142,328 | |
Population Median Age | 34 | 38 | 37 | |
Population by Age | 0-9 Yrs | 802 (13%) | 4898 (11%) | 16298 (11%) |
10-19 Yrs | 893 (15%) | 5948 (13%) | 20098 (14%) | |
20-29 Yrs | 903 (15%) | 6894 (15%) | 26524 (18%) | |
30-39 Yrs | 933 (15%) | 6313 (14%) | 18723 (13%) | |
40-49 Yrs | 696 (11%) | 5692 (12%) | 16472 (11%) | |
50-59 Yrs | 837 (14%) | 6332 (14%) | 18542 (13%) | |
60-69 Yrs | 554 (9%) | 5143 (11%) | 14437 (10%) | |
70+ Yrs | 238 (4%) | 3280 (7%) | 11234 (7%) | |
Median HH Income | $84,731 | $80,292 | $72,890 | |
Total Household Income | < 24K | 96 (4%) | 1710 (10%) | 7281 (14%) |
25-49K | 356 (16%) | 2978 (18%) | 9545 (19%) | |
50-74K | 416 (19%) | 2895 (17%) | 8957 (17%) | |
75-99K | 515 (24%) | 3154 (19%) | 7945 (15%) | |
100-199K | 599 (28%) | 4538 (27%) | 12896 (25%) | |
200K+ | 156 (7%) | 1228 (7%) | 3520 (7%) | |
Highest Education Level | No Diploma | 180 | 2314 | 8056 |
Diploma or GED | 837 | 8389 | 26530 | |
Some College | 735 | 6486 | 18337 | |
Assoc. Degree | 384 | 2630 | 6496 | |
Bachelors Degree | 1066 | 6724 | 19663 | |
Higher Degree | 743 | 4277 | 13161 | |
Total Housing Units | 2,252 | 17,523 | 54,068 | |
--Owner-Occupied | 1,387 | 11,136 | 31,803 | |
--Renter-Occupied | 752 | 5,367 | 18,342 | |
Owner-Occupied Values | < 100K | 32 | 663 | 2250 |
100-199K | 264 | 2362 | 7914 | |
200-299K | 503 | 4261 | 12011 | |
300-399K | 535 | 2870 | 7096 | |
400-499K | 15 | 634 | 1701 | |
500K+ | 38 | 346 | 832 | |
Total Working Age Population | 4,588 | 36,006 | 116,111 | |
In Work Force | 3,433 | 25,028 | 77,307 | |
Not In Work Force | 1,154 | 10,978 | 38,804 | |
Workforce Employed | 3,177 | 23,629 | 72,813 | |
Workforce Unemployed | 219 | 1,313 | 4,315 | |
Civlian Workforce | 3,396 | 24,942 | 77,128 | |
Military Workforce | 37 | 86 | 179 | |
Total Households | 2,138 | 16,503 | 50,145 | |
Family Households | 1,422 | 10,897 | 31,914 | |
Non-Family Households | 716 | 5,606 | 18,230 | |
Married Couple | 1,104 | 8,133 | 23,643 | |
Other Family | 318 | 2,764 | 8,272 | |
Married w/Child | 487 | 3,009 | 8,744 | |
Single Male w/Child | 38 | 415 | 1,352 | |
Single Female w/Child | 152 | 990 | 2,826 |
Population Change Last Two Decades - Plus Projection
2000 | % | 2010 | % | 2020 | % | 2030 | |
---|---|---|---|---|---|---|---|
Delaware | 783,600 | +15 | 897,934 | +10 | 989,803 | +6 | 1,044,965 |
New Castle County | 500,265 | +8 | 538,479 | +6 | 571,165 | +4 | 596,221 |
Maryland | 5,296,486 | +9 | 5,773,552 | +6 | 6,141,900 | +6 | 6,518,750 |
Cecil County | 85,951 | +18 | 101,108 | +3 | 104,600 | +14 | 119,550 |
Total Working Age Population:
Total Households:
Total Working Age Population:
Total Households:
Total Working Age Population:
Total Households: