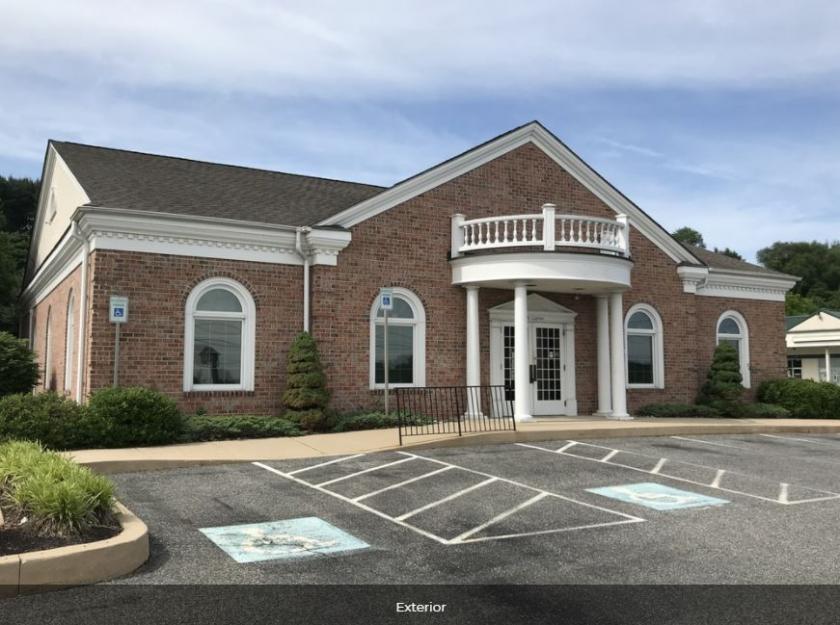
Office Space
741 West Cypress Street Kennett Square, PA 19348
741 West Cypress Street Kennett Square, PA 19348
Details & Description
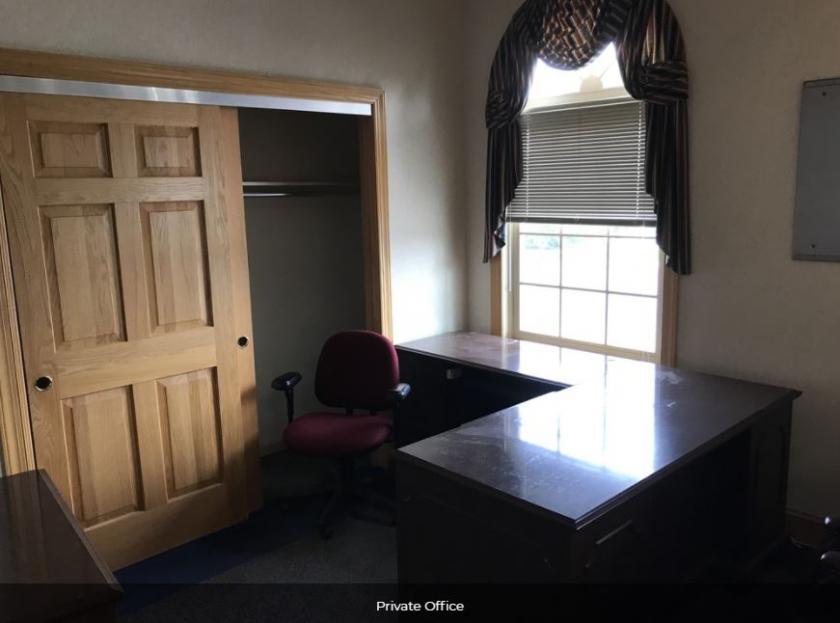
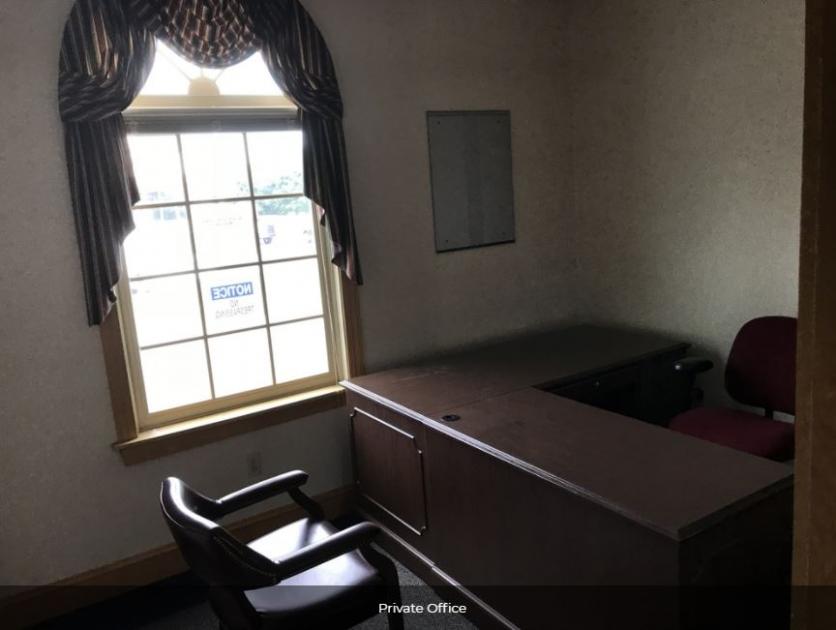
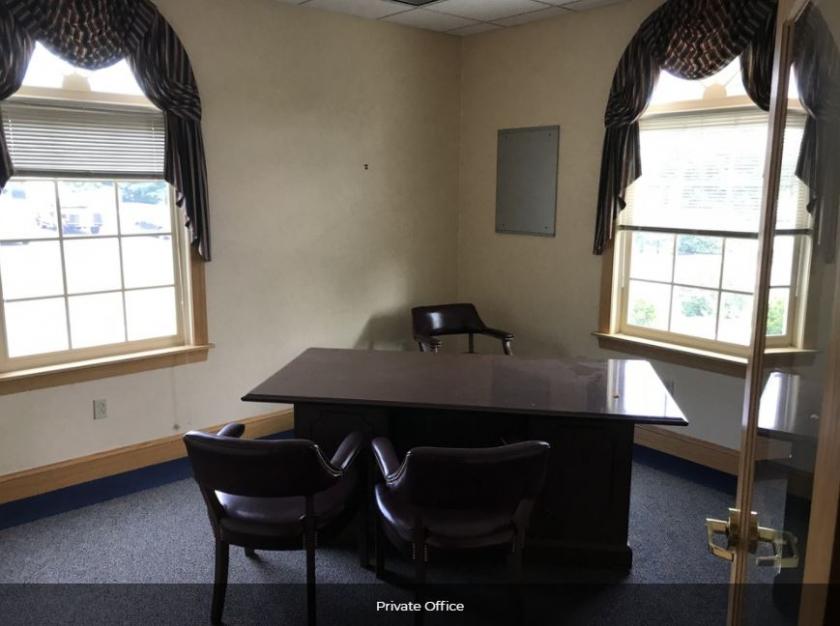
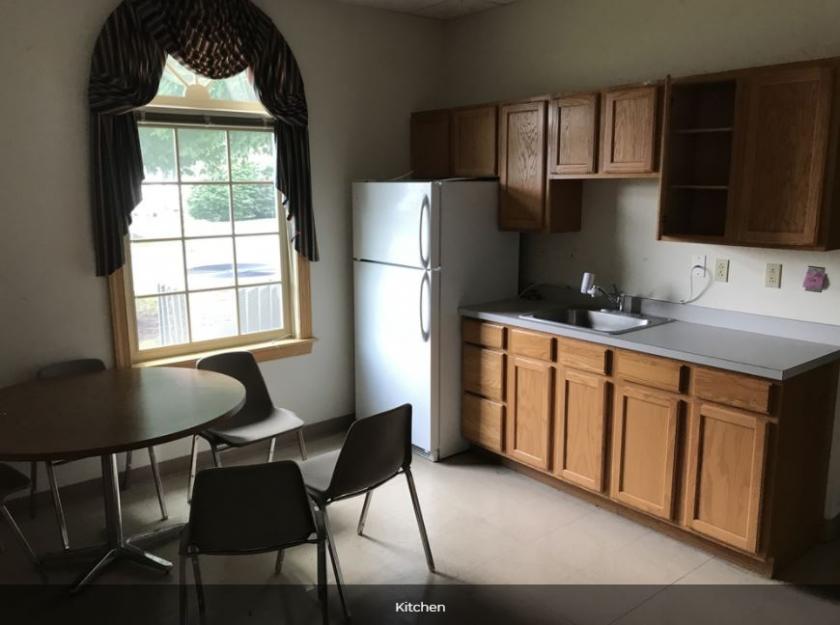
Additional Photos
Listing Agents

Jim OHara Jr.
O: 302-322-9500
M: 302-584-1632
jimohara@emoryhill.com
O: 302-322-9500
M: 302-584-1632
jimohara@emoryhill.com
While we strive to provide the most accurate information, all listing information, and demographic data, is provided by third-parties. As such, MyEListing will not be responsible for the accuracy of the information. It is strongly recommended that you verify all information with the listing agent, and any relevant agencies, prior to making any decisions.


