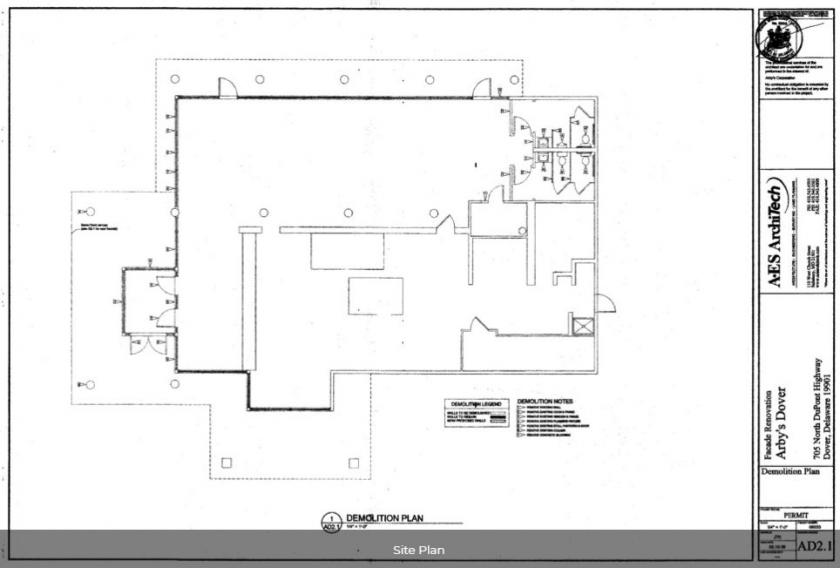
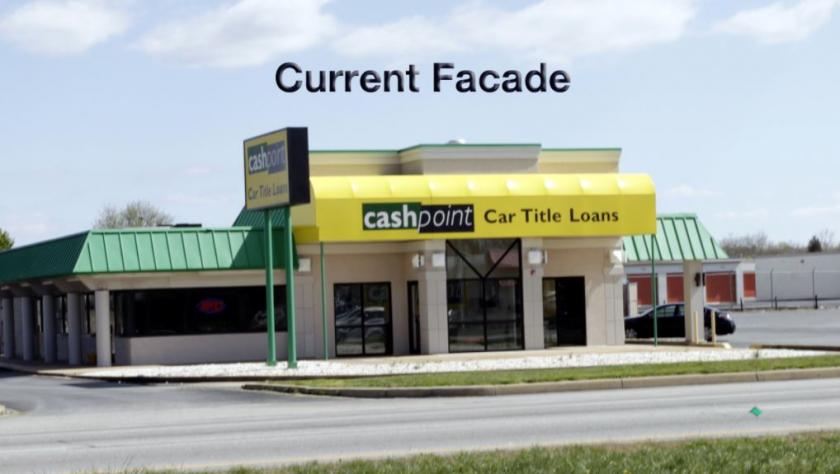
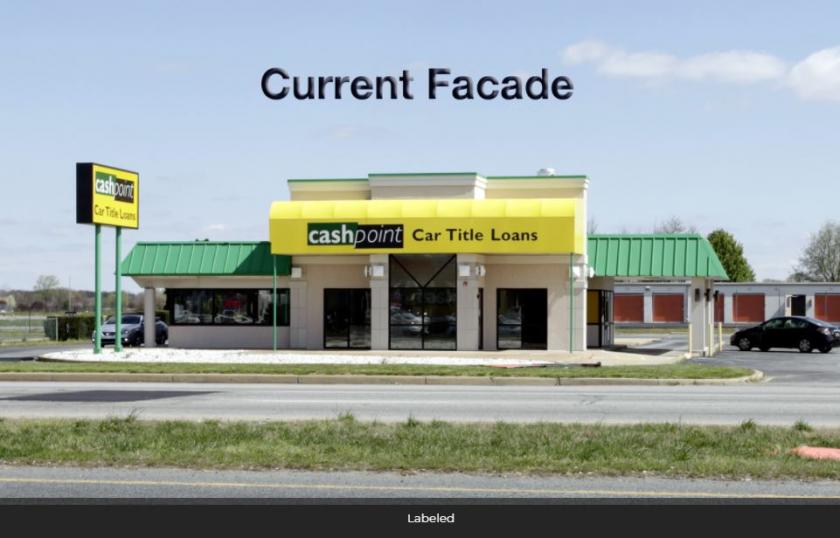
1-Mile | 3-Miles | 5-Miles | ||
---|---|---|---|---|
Total Population | 7,525 | 34,544 | 64,352 | |
Population Median Age | 38 | 37 | 38 | |
Population by Age | 0-9 Yrs | 465 (6%) | 3584 (10%) | 7611 (11%) |
10-19 Yrs | 1535 (20%) | 5577 (16%) | 9387 (14%) | |
20-29 Yrs | 1963 (26%) | 7318 (21%) | 12176 (18%) | |
30-39 Yrs | 587 (7%) | 3520 (10%) | 7397 (11%) | |
40-49 Yrs | 417 (5%) | 3039 (8%) | 5947 (9%) | |
50-59 Yrs | 754 (10%) | 4329 (12%) | 8159 (12%) | |
60-69 Yrs | 623 (8%) | 3026 (8%) | 6320 (9%) | |
70+ Yrs | 1180 (15%) | 4151 (12%) | 7355 (11%) | |
Median HH Income | $39,250 | $46,738 | $51,321 | |
Total Household Income | < 24K | 836 (30%) | 3545 (27%) | 5460 (22%) |
25-49K | 808 (29%) | 3276 (25%) | 6418 (26%) | |
50-74K | 406 (14%) | 2031 (15%) | 4139 (17%) | |
75-99K | 286 (10%) | 1612 (12%) | 3221 (13%) | |
100-199K | 360 (12%) | 1975 (15%) | 4041 (16%) | |
200K+ | 80 (2%) | 430 (3%) | 904 (3%) | |
Highest Education Level | No Diploma | 568 | 2764 | 5005 |
Diploma or GED | 1157 | 6264 | 12348 | |
Some College | 798 | 4783 | 9401 | |
Assoc. Degree | 380 | 1709 | 3229 | |
Bachelors Degree | 609 | 3076 | 6010 | |
Higher Degree | 488 | 2292 | 4702 | |
Total Housing Units | 3,057 | 14,364 | 26,609 | |
--Owner-Occupied | 1,229 | 6,603 | 13,726 | |
--Renter-Occupied | 1,547 | 6,267 | 10,456 | |
Owner-Occupied Values | < 100K | 96 | 851 | 2152 |
100-199K | 658 | 2872 | 4958 | |
200-299K | 374 | 2145 | 4170 | |
300-399K | 60 | 388 | 1406 | |
400-499K | 21 | 201 | 592 | |
500K+ | 19 | 146 | 447 | |
Total Working Age Population | 6,633 | 28,569 | 51,930 | |
In Work Force | 3,479 | 16,416 | 30,989 | |
Not In Work Force | 3,154 | 12,153 | 20,941 | |
Workforce Employed | 3,255 | 14,982 | 27,403 | |
Workforce Unemployed | 181 | 1,137 | 2,041 | |
Civlian Workforce | 3,436 | 16,120 | 29,444 | |
Military Workforce | 44 | 296 | 1,545 | |
Total Households | 2,775 | 12,870 | 24,182 | |
Family Households | 1,295 | 7,155 | 14,978 | |
Non-Family Households | 1,481 | 5,715 | 9,204 | |
Married Couple | 728 | 4,050 | 9,372 | |
Other Family | 567 | 3,105 | 5,605 | |
Married w/Child | 181 | 1,140 | 3,010 | |
Single Male w/Child | 7 | 257 | 612 | |
Single Female w/Child | 252 | 1,460 | 2,576 |
Population Change Last Two Decades - Plus Projection
2000 | % | 2010 | % | 2020 | % | 2030 | |
---|---|---|---|---|---|---|---|
Delaware | 783,600 | +15 | 897,934 | +10 | 989,803 | +6 | 1,044,965 |
Kent County | 126,697 | +28 | 162,310 | +13 | 183,242 | +6 | 193,601 |
New Jersey | 8,414,350 | +4 | 8,791,894 | +4 | 9,132,700 | +4 | 9,530,900 |
Cumberland County | 146,438 | +7 | 156,898 | +1 | 158,600 | +2 | 162,000 |
Total Working Age Population:
Total Households:
Total Working Age Population:
Total Households:
Total Working Age Population:
Total Households: