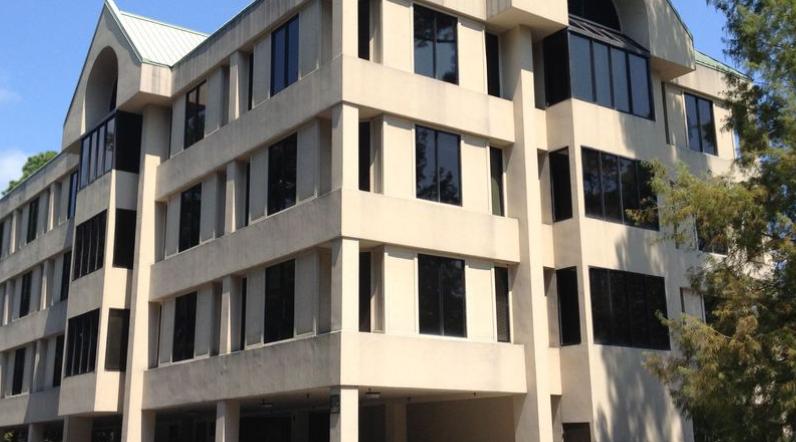
This 3,270sf professional office condo located on the second floor of The Jade Building with elevator access. The Jade Building one of Hilton Head Island’s premiere office buildings. This condo is approximately half of the second floor.
The layout consists of reception, 7 offices, conference room, copy/file room, and storage. Men's and women's bathrooms are common for the floor.
Other notable businesses in the building are William M. Bowen, P.A., Novit & Scarminach, P.A. Attorneys at Law and Frey Media. Square Footage to be confirmed by Buyer.
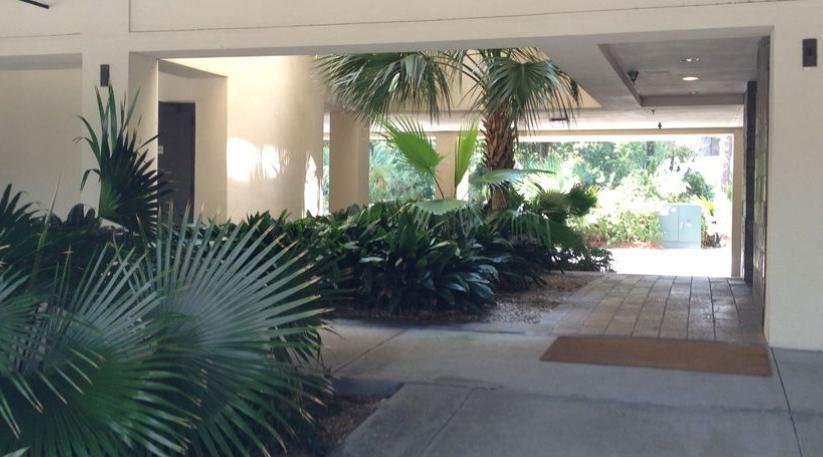
Ample parking (both covered and open-air) that is shared amongst all businesses in the complex, as well as monument signage on New Orleans Road.
Great opportunity for a professional office user looking to own their own space and pay themselves rent.
There are currently two tenants occupying the space. Contact agent for further details on tenants and lease terms.
Highlights
South End Professional Office Condo for Sale
Near Sea Pines Circle
No part of this information may be copied, reproduced, repurposed, or screen-captured for any commercial purpose without prior written authorization from MyEListing.
While we strive to provide the most accurate information, all listing information, and demographic data, is provided by third-parties. As such, MyEListing will not be responsible for the accuracy of the information. It is strongly recommended that you verify all information with the listing agent, and any relevant agencies, prior to making any decisions.
What is the asking price for 52 New Orleans Road in Hilton Head Island?
The asking price for 52 New Orleans Road is $275,000
What is the building size of this Office property in Hilton Head Island, SC?
The size of the building/unit at 52 New Orleans Road in Hilton Head Island is 3,270 square feet
What kind of Office is the propery at 52 New Orleans Road?
The property at 52 New Orleans Road Hilton Head Island, SC 29928 is listed as a Professional Office property
What is the population within 1 mile of 52 New Orleans Road in Hilton Head Island?
The population within 1 mile of 52 New Orleans Road Hilton Head Island, SC 29928 is 2,768 people.
Who do I contact for questions about 52 New Orleans Road?
You should contact the listing agent,
Baker Wilkins, for any details regarding this commercial listing.