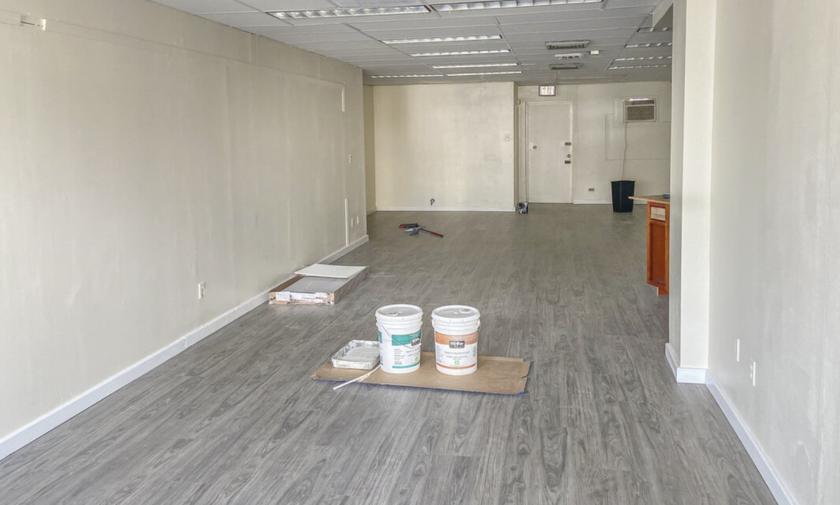
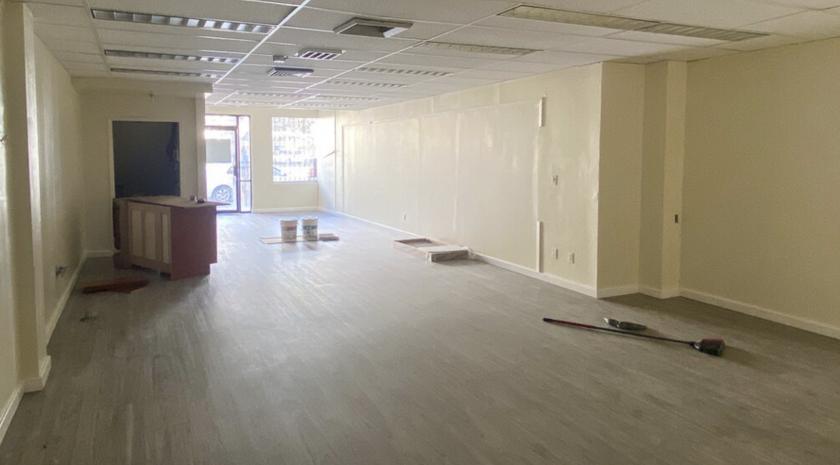
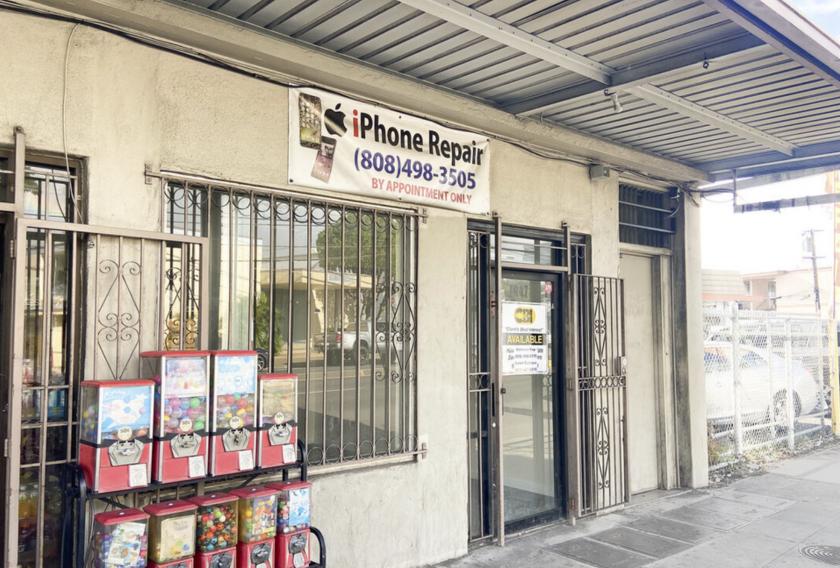
1-Mile | 3-Miles | 5-Miles | ||
---|---|---|---|---|
Total Population | 39,609 | 165,254 | 318,997 | |
Population Median Age | 39 | 41 | 41 | |
Population by Age | 0-9 Yrs | 4664 (11%) | 18933 (11%) | 34610 (10%) |
10-19 Yrs | 4527 (11%) | 16345 (9%) | 30807 (9%) | |
20-29 Yrs | 6158 (15%) | 23305 (14%) | 50112 (15%) | |
30-39 Yrs | 5289 (13%) | 23879 (14%) | 46673 (14%) | |
40-49 Yrs | 5384 (13%) | 20212 (12%) | 38862 (12%) | |
50-59 Yrs | 5340 (13%) | 21933 (13%) | 40953 (12%) | |
60-69 Yrs | 4082 (10%) | 19060 (11%) | 36608 (11%) | |
70+ Yrs | 4165 (10%) | 21587 (13%) | 40372 (12%) | |
Median HH Income | $69,058 | $70,095 | $70,283 | |
Total Household Income | < 24K | 1781 (19%) | 9747 (17%) | 19728 (17%) |
25-49K | 1697 (18%) | 10025 (18%) | 21462 (18%) | |
50-74K | 1342 (14%) | 9437 (17%) | 19686 (17%) | |
75-99K | 1124 (12%) | 7174 (13%) | 14978 (13%) | |
100-199K | 2221 (24%) | 13249 (24%) | 28325 (24%) | |
200K+ | 862 (9%) | 5111 (9%) | 10318 (9%) | |
Highest Education Level | No Diploma | 7334 | 19134 | 27134 |
Diploma or GED | 8383 | 31214 | 55487 | |
Some College | 4877 | 22638 | 43064 | |
Assoc. Degree | 2978 | 12069 | 24462 | |
Bachelors Degree | 3196 | 23936 | 51925 | |
Higher Degree | 740 | 11353 | 29148 | |
Total Housing Units | 9,603 | 60,033 | 134,946 | |
--Owner-Occupied | 3,553 | 23,079 | 47,692 | |
--Renter-Occupied | 5,474 | 31,665 | 66,804 | |
Owner-Occupied Values | < 100K | 98 | 381 | 849 |
100-199K | 101 | 539 | 1101 | |
200-299K | 659 | 2183 | 4015 | |
300-399K | 277 | 3638 | 7057 | |
400-499K | 167 | 2260 | 5141 | |
500K+ | 2251 | 14078 | 29529 | |
Total Working Age Population | 32,550 | 136,540 | 266,777 | |
In Work Force | 21,388 | 88,806 | 176,535 | |
Not In Work Force | 11,162 | 47,733 | 90,242 | |
Workforce Employed | 20,071 | 81,381 | 159,027 | |
Workforce Unemployed | 1,188 | 3,598 | 6,512 | |
Civlian Workforce | 21,258 | 84,979 | 165,539 | |
Military Workforce | 130 | 3,827 | 10,996 | |
Total Households | 9,027 | 54,744 | 114,497 | |
Family Households | 7,217 | 35,389 | 68,480 | |
Non-Family Households | 1,810 | 19,355 | 46,017 | |
Married Couple | 4,053 | 24,713 | 49,490 | |
Other Family | 3,164 | 10,676 | 18,990 | |
Married w/Child | 1,433 | 9,161 | 18,462 | |
Single Male w/Child | 131 | 864 | 1,578 | |
Single Female w/Child | 724 | 2,574 | 4,904 |
Population Change Last Two Decades - Plus Projection
2000 | % | 2010 | % | 2020 | % | 2030 | |
---|---|---|---|---|---|---|---|
Hawaii | 1,211,537 | +12 | 1,360,301 | +8 | 1,466,632 | +6 | 1,556,843 |
Honolulu County | 876,156 | +9 | 953,207 | +6 | 1,010,123 | +4 | 1,050,077 |
Total Working Age Population:
Total Households:
Total Working Age Population:
Total Households:
Total Working Age Population:
Total Households: