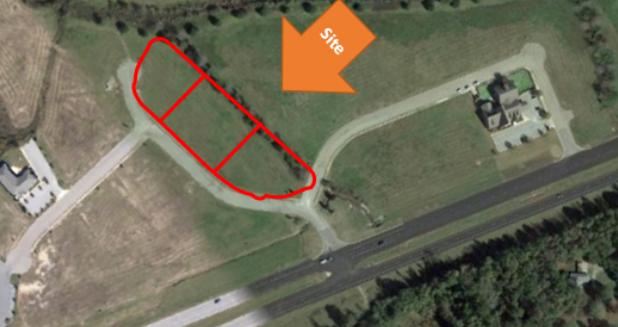
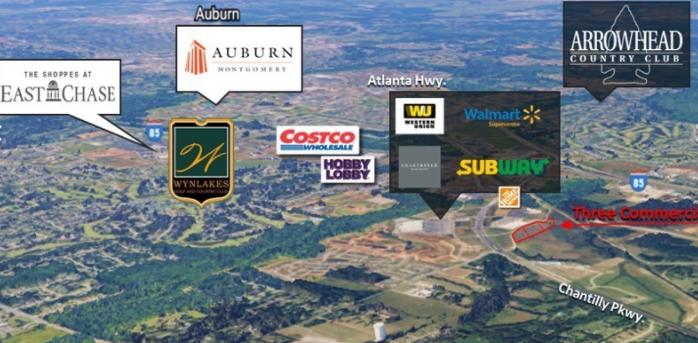
1-Mile | 3-Miles | 5-Miles | ||
---|---|---|---|---|
Total Population | 1,800 | 23,493 | 55,018 | |
Population Median Age | 39 | 39 | 38 | |
Population by Age | 0-9 Yrs | 240 (13%) | 3213 (13%) | 7508 (13%) |
10-19 Yrs | 206 (11%) | 3005 (12%) | 7045 (12%) | |
20-29 Yrs | 246 (13%) | 2292 (9%) | 7209 (13%) | |
30-39 Yrs | 223 (12%) | 2884 (12%) | 6949 (12%) | |
40-49 Yrs | 242 (13%) | 3866 (16%) | 8216 (14%) | |
50-59 Yrs | 239 (13%) | 3146 (13%) | 7212 (13%) | |
60-69 Yrs | 229 (12%) | 2773 (11%) | 6150 (11%) | |
70+ Yrs | 175 (9%) | 2314 (9%) | 4730 (8%) | |
Median HH Income | $88,068 | $96,262 | $78,921 | |
Total Household Income | < 24K | 68 (9%) | 813 (8%) | 2822 (12%) |
25-49K | 49 (7%) | 922 (9%) | 3466 (15%) | |
50-74K | 167 (24%) | 1669 (17%) | 4216 (19%) | |
75-99K | 114 (16%) | 1451 (15%) | 3544 (16%) | |
100-199K | 201 (29%) | 3304 (35%) | 6185 (27%) | |
200K+ | 88 (12%) | 1118 (12%) | 1887 (8%) | |
Highest Education Level | No Diploma | 37 | 590 | 1681 |
Diploma or GED | 260 | 2190 | 6326 | |
Some College | 271 | 2617 | 7064 | |
Assoc. Degree | 49 | 976 | 2623 | |
Bachelors Degree | 464 | 5369 | 11170 | |
Higher Degree | 212 | 4523 | 8341 | |
Total Housing Units | 727 | 9,759 | 23,810 | |
--Owner-Occupied | 511 | 6,923 | 14,839 | |
--Renter-Occupied | 175 | 2,353 | 7,280 | |
Owner-Occupied Values | < 100K | 13 | 244 | 1403 |
100-199K | 222 | 1823 | 5299 | |
200-299K | 112 | 2034 | 3849 | |
300-399K | 49 | 1668 | 2541 | |
400-499K | 53 | 630 | 883 | |
500K+ | 63 | 524 | 864 | |
Total Working Age Population | 1,453 | 18,318 | 43,221 | |
In Work Force | 971 | 12,035 | 28,796 | |
Not In Work Force | 482 | 6,284 | 14,425 | |
Workforce Employed | 926 | 11,456 | 27,350 | |
Workforce Unemployed | 42 | 315 | 945 | |
Civlian Workforce | 968 | 11,771 | 28,295 | |
Military Workforce | 3 | 264 | 501 | |
Total Households | 686 | 9,276 | 22,119 | |
Family Households | 505 | 6,606 | 14,878 | |
Non-Family Households | 181 | 2,670 | 7,241 | |
Married Couple | 424 | 5,659 | 11,782 | |
Other Family | 81 | 947 | 3,096 | |
Married w/Child | 175 | 2,541 | 5,017 | |
Single Male w/Child | 1 | 140 | 402 | |
Single Female w/Child | 32 | 382 | 1,479 |
Population Change Last Two Decades - Plus Projection
2000 | % | 2010 | % | 2020 | % | 2030 | |
---|---|---|---|---|---|---|---|
Alabama | 4,447,100 | +7 | 4,779,736 | +3 | 4,940,253 | +4 | 5,124,380 |
Elmore County | 65,874 | +20 | 79,303 | +6 | 83,991 | +6 | 89,231 |
Montgomery County | 223,510 | +3 | 229,363 | -1 | 226,832 | +1 | 228,160 |
Total Working Age Population:
Total Households:
Total Working Age Population:
Total Households:
Total Working Age Population:
Total Households: