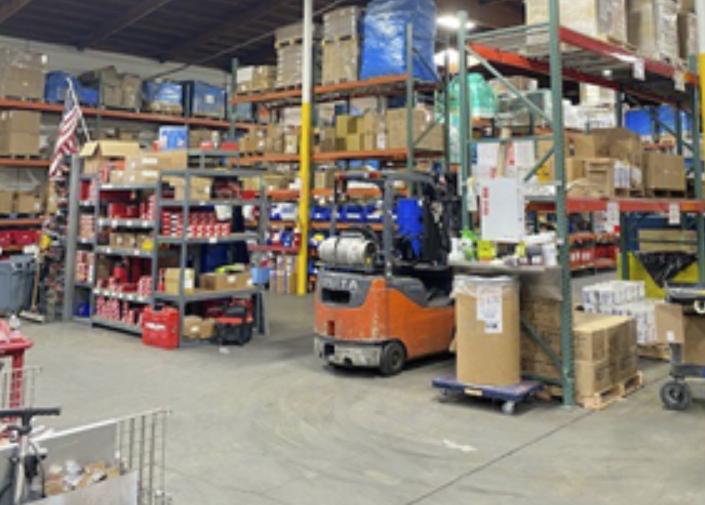
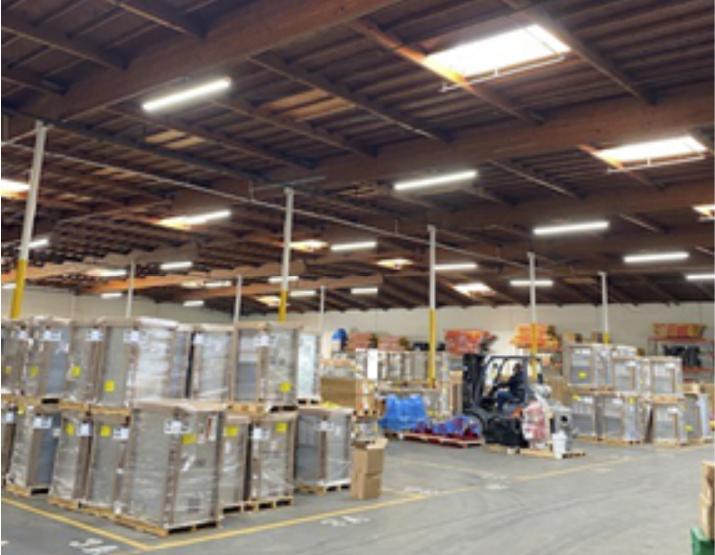
1-Mile | 3-Miles | 5-Miles | ||
---|---|---|---|---|
Total Population | 13,222 | 310,137 | 879,872 | |
Population Median Age | 35 | 34 | 34 | |
Population by Age | 0-9 Yrs | 1882 (14%) | 45968 (14%) | 125489 (14%) |
10-19 Yrs | 1917 (14%) | 49690 (16%) | 135956 (15%) | |
20-29 Yrs | 2504 (18%) | 53218 (17%) | 146616 (16%) | |
30-39 Yrs | 1581 (11%) | 43537 (14%) | 124770 (14%) | |
40-49 Yrs | 1807 (13%) | 40400 (13%) | 117184 (13%) | |
50-59 Yrs | 1609 (12%) | 34866 (11%) | 98180 (11%) | |
60-69 Yrs | 908 (6%) | 23104 (7%) | 71210 (8%) | |
70+ Yrs | 1014 (7%) | 19353 (6%) | 60467 (6%) | |
Median HH Income | $42,203 | $44,976 | $48,093 | |
Total Household Income | < 24K | 815 (23%) | 18786 (24%) | 56553 (24%) |
25-49K | 1149 (32%) | 23768 (30%) | 62133 (27%) | |
50-74K | 512 (14%) | 14988 (19%) | 41190 (17%) | |
75-99K | 436 (12%) | 8991 (11%) | 26724 (11%) | |
100-199K | 520 (14%) | 9676 (12%) | 35927 (15%) | |
200K+ | 57 (1%) | 1255 (1%) | 6613 (2%) | |
Highest Education Level | No Diploma | 3914 | 91673 | 235200 |
Diploma or GED | 2202 | 48328 | 135516 | |
Some College | 1511 | 27225 | 85161 | |
Assoc. Degree | 190 | 7306 | 26202 | |
Bachelors Degree | 455 | 10932 | 48254 | |
Higher Degree | 125 | 2908 | 16446 | |
Total Housing Units | 3,589 | 80,322 | 239,715 | |
--Owner-Occupied | 1,166 | 23,022 | 79,992 | |
--Renter-Occupied | 2,323 | 54,442 | 149,148 | |
Owner-Occupied Values | < 100K | 18 | 657 | 2050 |
100-199K | 24 | 490 | 1513 | |
200-299K | 216 | 2190 | 6809 | |
300-399K | 371 | 7106 | 20561 | |
400-499K | 363 | 7081 | 21206 | |
500K+ | 174 | 5499 | 27854 | |
Total Working Age Population | 10,266 | 233,826 | 671,874 | |
In Work Force | 6,488 | 149,576 | 419,971 | |
Not In Work Force | 3,778 | 84,250 | 251,903 | |
Workforce Employed | 6,043 | 137,253 | 386,700 | |
Workforce Unemployed | 444 | 12,312 | 33,187 | |
Civlian Workforce | 6,488 | 149,564 | 419,887 | |
Military Workforce | 0 | 12 | 84 | |
Total Households | 3,489 | 77,464 | 229,140 | |
Family Households | 2,855 | 64,808 | 180,974 | |
Non-Family Households | 634 | 12,657 | 48,166 | |
Married Couple | 1,807 | 37,380 | 105,037 | |
Other Family | 1,048 | 27,428 | 75,937 | |
Married w/Child | 991 | 18,995 | 50,654 | |
Single Male w/Child | 170 | 3,515 | 10,347 | |
Single Female w/Child | 392 | 9,464 | 25,335 |
Population Change Last Two Decades - Plus Projection
2000 | % | 2010 | % | 2020 | % | 2030 | |
---|---|---|---|---|---|---|---|
California | 33,871,648 | +10 | 37,253,956 | +9 | 40,467,295 | +8 | 43,631,295 |
Los Angeles County | 9,519,338 | +3 | 9,818,605 | +6 | 10,369,367 | +4 | 10,759,850 |
Orange County | 2,846,289 | +6 | 3,010,232 | +8 | 3,257,087 | +5 | 3,431,096 |
Total Working Age Population:
Total Households:
Total Working Age Population:
Total Households:
Total Working Age Population:
Total Households: