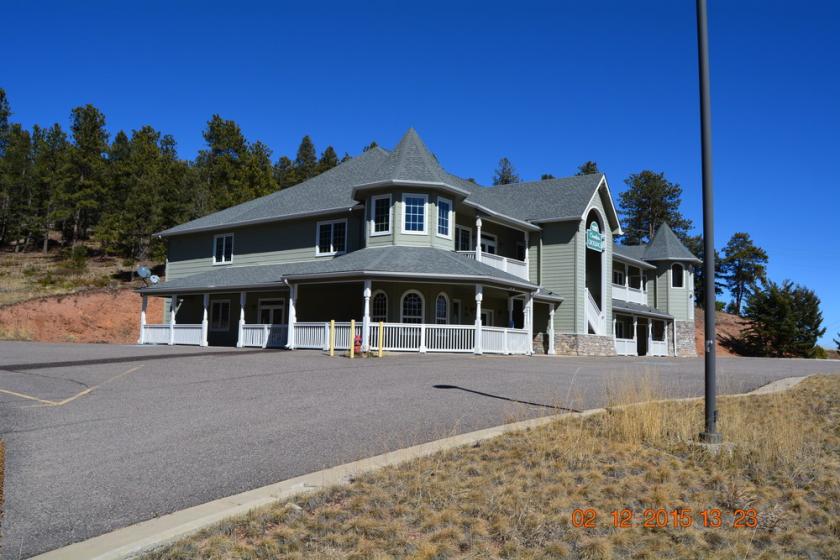
1-Mile | 3-Miles | 5-Miles | ||
---|---|---|---|---|
Total Population | 453 | 4,022 | 10,964 | |
Population Median Age | 43 | 43 | 43 | |
Population by Age | 0-9 Yrs | 34 (7%) | 399 (9%) | 1211 (11%) |
10-19 Yrs | 76 (16%) | 463 (11%) | 1206 (10%) | |
20-29 Yrs | 8 (1%) | 136 (3%) | 451 (4%) | |
30-39 Yrs | 64 (14%) | 575 (14%) | 1495 (13%) | |
40-49 Yrs | 58 (12%) | 563 (13%) | 1640 (14%) | |
50-59 Yrs | 104 (22%) | 924 (22%) | 2271 (20%) | |
60-69 Yrs | 62 (13%) | 608 (15%) | 1761 (16%) | |
70+ Yrs | 47 (10%) | 354 (8%) | 930 (8%) | |
Median HH Income | $118,235 | $114,646 | $110,152 | |
Total Household Income | < 24K | 19 (10%) | 104 (6%) | 260 (5%) |
25-49K | 15 (8%) | 170 (10%) | 483 (10%) | |
50-74K | 28 (14%) | 218 (12%) | 564 (12%) | |
75-99K | 21 (11%) | 216 (12%) | 665 (14%) | |
100-199K | 67 (35%) | 630 (37%) | 1744 (38%) | |
200K+ | 37 (19%) | 341 (20%) | 777 (17%) | |
Highest Education Level | No Diploma | 16 | 98 | 239 |
Diploma or GED | 49 | 490 | 1275 | |
Some College | 74 | 690 | 1953 | |
Assoc. Degree | 23 | 232 | 761 | |
Bachelors Degree | 107 | 981 | 2556 | |
Higher Degree | 69 | 604 | 1567 | |
Total Housing Units | 192 | 1,745 | 4,736 | |
--Owner-Occupied | 158 | 1,493 | 4,056 | |
--Renter-Occupied | 29 | 185 | 437 | |
Owner-Occupied Values | < 100K | 0 | 13 | 69 |
100-199K | 7 | 28 | 43 | |
200-299K | 10 | 104 | 418 | |
300-399K | 31 | 299 | 824 | |
400-499K | 35 | 441 | 1134 | |
500K+ | 74 | 607 | 1568 | |
Total Working Age Population | 361 | 3,295 | 8,921 | |
In Work Force | 259 | 2,362 | 6,321 | |
Not In Work Force | 102 | 933 | 2,600 | |
Workforce Employed | 251 | 2,249 | 6,033 | |
Workforce Unemployed | 7 | 113 | 288 | |
Civlian Workforce | 259 | 2,362 | 6,321 | |
Military Workforce | 0 | 0 | 0 | |
Total Households | 187 | 1,679 | 4,493 | |
Family Households | 135 | 1,252 | 3,429 | |
Non-Family Households | 52 | 427 | 1,064 | |
Married Couple | 120 | 1,151 | 3,092 | |
Other Family | 14 | 101 | 338 | |
Married w/Child | 45 | 353 | 999 | |
Single Male w/Child | 3 | 20 | 76 | |
Single Female w/Child | 0 | 10 | 45 |
Population Change Last Two Decades - Plus Projection
2000 | % | 2010 | % | 2020 | % | 2030 | |
---|---|---|---|---|---|---|---|
Colorado | 4,301,261 | +17 | 5,029,196 | +16 | 5,838,181 | +15 | 6,733,658 |
Douglas County | 175,766 | +62 | 285,465 | +23 | 350,161 | +16 | 405,087 |
Jefferson County | 527,056 | +1 | 534,543 | +10 | 587,118 | +7 | 626,742 |
Park County | 14,523 | +12 | 16,206 | +15 | 18,642 | +14 | 21,229 |
Total Working Age Population:
Total Households:
Total Working Age Population:
Total Households:
Total Working Age Population:
Total Households: