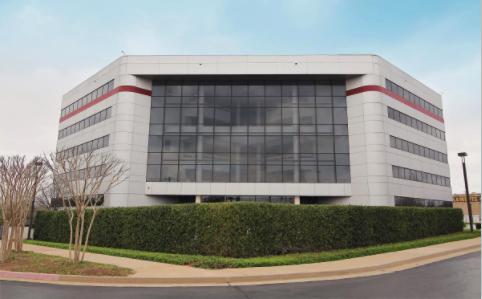
Office Space
301 Northwest 63rd Street Oklahoma City, OK 73116
301 Northwest 63rd Street Oklahoma City, OK 73116
Details & Description
Property Highlights
- • Excellent access to 1-235, I-44 and NW 63rd Street
- • Ample parking available
- • After hours secured access including 24 hour video
- • On-site Fitness Center
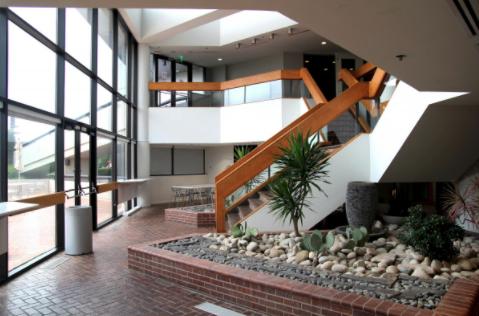
- • Some suites have views of the downtown skyline
Listing Agents

Craig Tucker
O: 405-239-1202
M: 405-641-3218
ctucker@priceedwards.com
O: 405-239-1202
M: 405-641-3218
ctucker@priceedwards.com

Tre Dupuy
O: 405-239-1210
tdupuy@priceedwards.com
O: 405-239-1210
tdupuy@priceedwards.com
While we strive to provide the most accurate information, all listing information, and demographic data, is provided by third-parties. As such, MyEListing will not be responsible for the accuracy of the information. It is strongly recommended that you verify all information with the listing agent, and any relevant agencies, prior to making any decisions.