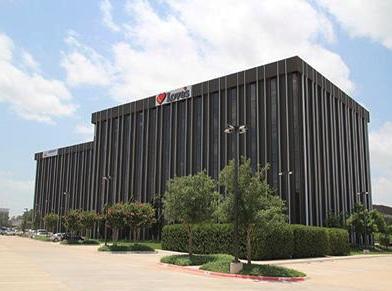
Office Space
3503 Northwest 63rd Street Oklahoma City, OK 73116
3503 Northwest 63rd Street Oklahoma City, OK 73116
Details & Description
Property Highlights
- • Ample free parking
- • Upper floors offer view of Lake Hefner
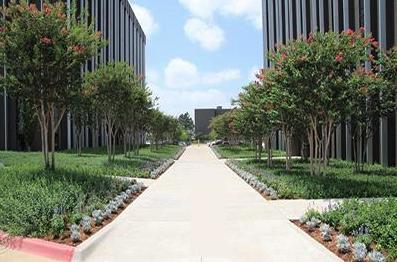
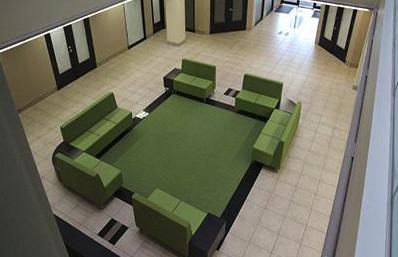
- • Atrium allows natural light to interior offices
- • Superb visibility from Lake Hefner Parkway
- • Numerous restaurants, banks shopping nearby
- • 4th and 5th floor spaces include like new furnitu
Listing Agents

Craig Tucker
O: 405-239-1202
M: 405-641-3218
ctucker@priceedwards.com
O: 405-239-1202
M: 405-641-3218
ctucker@priceedwards.com

Tom Fields
O: 405-239-1205
tfields@priceedwards.com
O: 405-239-1205
tfields@priceedwards.com
While we strive to provide the most accurate information, all listing information, and demographic data, is provided by third-parties. As such, MyEListing will not be responsible for the accuracy of the information. It is strongly recommended that you verify all information with the listing agent, and any relevant agencies, prior to making any decisions.