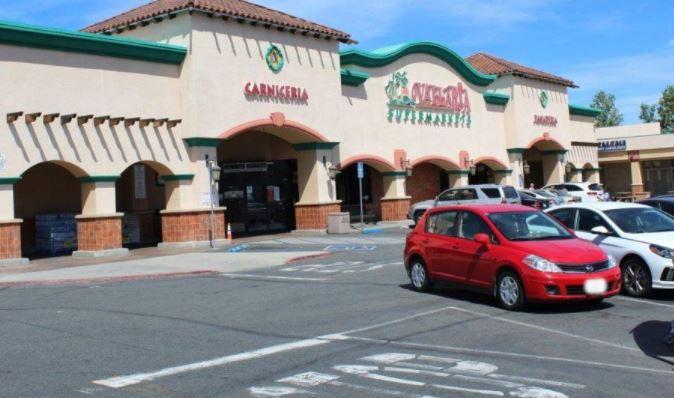
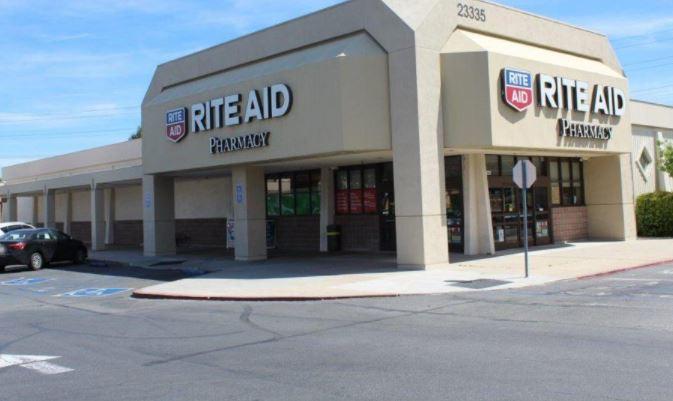
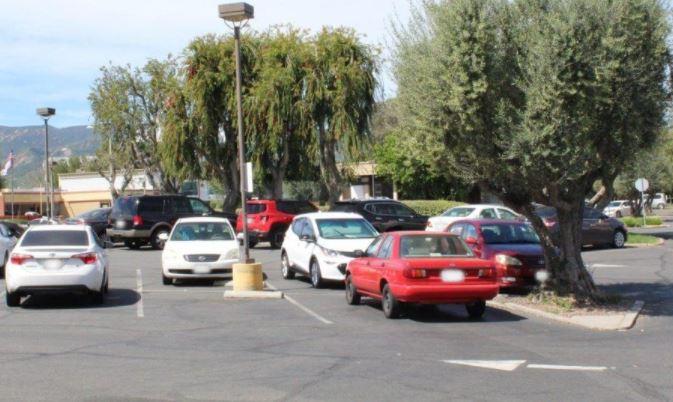
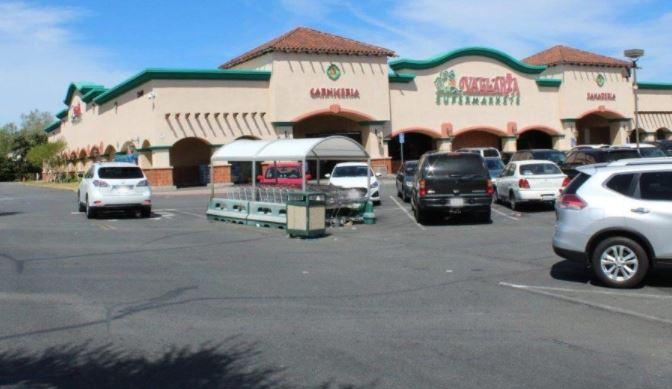
1-Mile | 3-Miles | 5-Miles | ||
---|---|---|---|---|
Total Population | 18,826 | 63,718 | 143,698 | |
Population Median Age | 36 | 38 | 38 | |
Population by Age | 0-9 Yrs | 2846 (15%) | 7944 (12%) | 18900 (13%) |
10-19 Yrs | 2995 (15%) | 9233 (14%) | 20428 (14%) | |
20-29 Yrs | 2431 (12%) | 8630 (13%) | 18284 (12%) | |
30-39 Yrs | 2301 (12%) | 7504 (11%) | 17643 (12%) | |
40-49 Yrs | 2156 (11%) | 8644 (13%) | 20860 (14%) | |
50-59 Yrs | 2737 (14%) | 9203 (14%) | 20787 (14%) | |
60-69 Yrs | 1773 (9%) | 6755 (10%) | 14695 (10%) | |
70+ Yrs | 1587 (8%) | 5806 (9%) | 12101 (8%) | |
Median HH Income | $81,505 | $90,072 | $99,880 | |
Total Household Income | < 24K | 866 (15%) | 3044 (13%) | 5025 (10%) |
25-49K | 1043 (18%) | 3318 (15%) | 6601 (13%) | |
50-74K | 793 (13%) | 2948 (13%) | 6540 (13%) | |
75-99K | 625 (10%) | 2627 (12%) | 5906 (12%) | |
100-199K | 1797 (31%) | 7064 (32%) | 16663 (34%) | |
200K+ | 605 (10%) | 2786 (12%) | 7352 (15%) | |
Highest Education Level | No Diploma | 2225 | 4875 | 9009 |
Diploma or GED | 2440 | 7496 | 16517 | |
Some College | 2524 | 10699 | 23500 | |
Assoc. Degree | 1098 | 3889 | 9363 | |
Bachelors Degree | 2337 | 10060 | 24396 | |
Higher Degree | 1060 | 5140 | 12748 | |
Total Housing Units | 5,904 | 22,525 | 49,369 | |
--Owner-Occupied | 3,310 | 12,612 | 32,707 | |
--Renter-Occupied | 2,419 | 9,175 | 15,381 | |
Owner-Occupied Values | < 100K | 58 | 372 | 1157 |
100-199K | 57 | 255 | 1084 | |
200-299K | 148 | 554 | 1548 | |
300-399K | 258 | 1589 | 3590 | |
400-499K | 513 | 2297 | 6266 | |
500K+ | 2276 | 7544 | 19062 | |
Total Working Age Population | 14,351 | 50,460 | 112,505 | |
In Work Force | 9,245 | 32,657 | 74,936 | |
Not In Work Force | 5,106 | 17,803 | 37,569 | |
Workforce Employed | 8,723 | 30,848 | 71,009 | |
Workforce Unemployed | 521 | 1,763 | 3,866 | |
Civlian Workforce | 9,245 | 32,611 | 74,875 | |
Military Workforce | 0 | 46 | 61 | |
Total Households | 5,728 | 21,787 | 48,088 | |
Family Households | 4,357 | 15,234 | 35,184 | |
Non-Family Households | 1,371 | 6,553 | 12,904 | |
Married Couple | 3,316 | 11,808 | 27,790 | |
Other Family | 1,041 | 3,426 | 7,394 | |
Married w/Child | 1,560 | 5,329 | 13,407 | |
Single Male w/Child | 213 | 822 | 1,515 | |
Single Female w/Child | 334 | 929 | 2,023 |
Population Change Last Two Decades - Plus Projection
2000 | % | 2010 | % | 2020 | % | 2030 | |
---|---|---|---|---|---|---|---|
California | 33,871,648 | +10 | 37,253,956 | +9 | 40,467,295 | +8 | 43,631,295 |
Los Angeles County | 9,519,338 | +3 | 9,818,605 | +6 | 10,369,367 | +4 | 10,759,850 |
Total Working Age Population:
Total Households:
Total Working Age Population:
Total Households:
Total Working Age Population:
Total Households: