Retail Space
12835 Telge Road Cypress, TX 77429
12835 Telge Road Cypress, TX 77429
Details & Description
Property Highlights
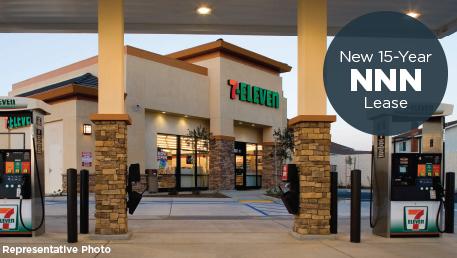
- • 7-Eleven
- • Investment Grade Credit
- • Exceptional Location
- • Absolute Net Lease Investment
- • Attractive 10 Rental Increases
- • Primary Community Corridor
Listing Agents

Jim Gibson
O: 713-972-4645
jwgibson@northmarq.com
O: 713-972-4645
jwgibson@northmarq.com
While we strive to provide the most accurate information, all listing information, and demographic data, is provided by third-parties. As such, MyEListing will not be responsible for the accuracy of the information. It is strongly recommended that you verify all information with the listing agent, and any relevant agencies, prior to making any decisions.