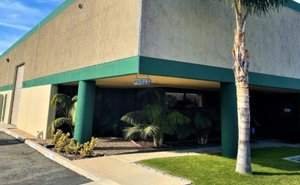
4,300 SF Office, Warehouse and Mezzanine
1,400 SF Office Space & 1,200 SF Warehouse
1,700 SF Mezzanine (included in total SF)
(6) Newly Refurbished Offices
End Unit, Drive-Around Access
Kitchenette & Two Restrooms
(1) 16? x 14? Oversized Automatic GL Door
Sprinklered, Air-lines, 200 Amps (Verify)
Prime Costa Mesa/Airport Location
Immediate 405, 55 & 73 Freeway Access
No part of this information may be copied, reproduced, repurposed, or screen-captured for any commercial purpose without prior written authorization from MyEListing.
While we strive to provide the most accurate information, all listing information, and demographic data, is provided by third-parties. As such, MyEListing will not be responsible for the accuracy of the information. It is strongly recommended that you verify all information with the listing agent, and any relevant agencies, prior to making any decisions.
What is the asking price for 245 Fischer Avenue in Costa Mesa?
The asking price for 245 Fischer Avenue is $13.92 a SF per Year
What is the building size of this commercial Flex/Office Whs property?
The size of this lease property at '.245 Fischer Avenue.' is 4300 square feet
What is the population within 1 mile of 245 Fischer Avenue in Costa Mesa?
The population within 1 mile of 245 Fischer Avenue Costa Mesa, CA 92626 is 14,683 people.
Who do I contact for questions about 245 Fischer Avenue?
You should contact the listing agent,
Devin Ray, for any details regarding this commercial listing.