Industrial Properties
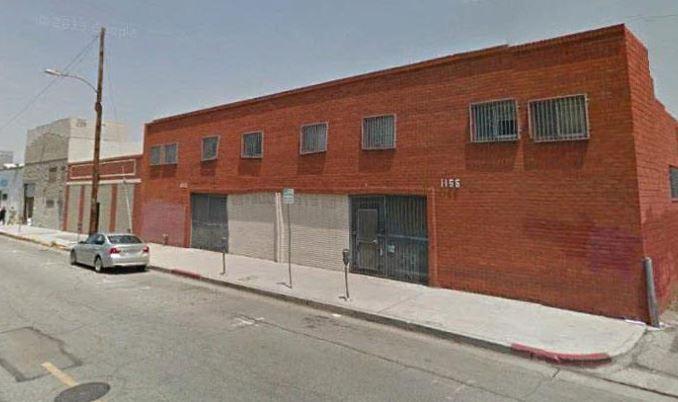
1153 East Pico Boulevard Los Angeles, CA 90021
1153 East Pico Boulevard Los Angeles, CA 90021
Details & Description
Listing Agents

Dan Daneshrad
O: 213-270-2248
dan.daneshrad@daumcommercial.com
O: 213-270-2248
dan.daneshrad@daumcommercial.com
While we strive to provide the most accurate information, all listing information, and demographic data, is provided by third-parties. As such, MyEListing will not be responsible for the accuracy of the information. It is strongly recommended that you verify all information with the listing agent, and any relevant agencies, prior to making any decisions.
