Office Space
150 Bay Street Jersey City, NJ 07302
150 Bay Street Jersey City, NJ 07302
Details & Description
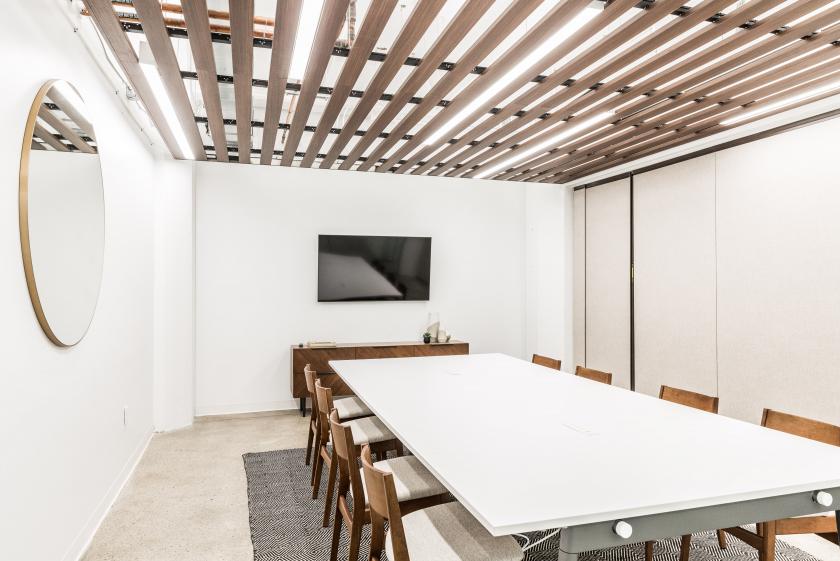
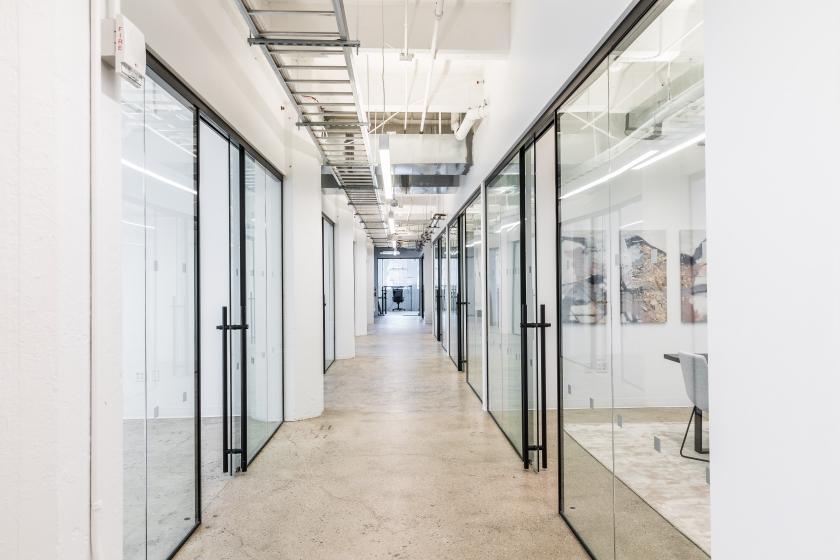
Property Highlights
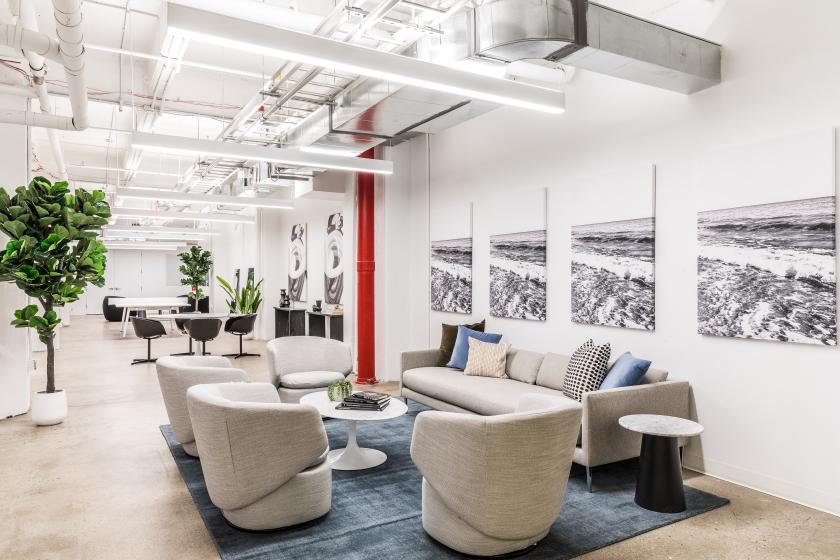
- • Landmark building
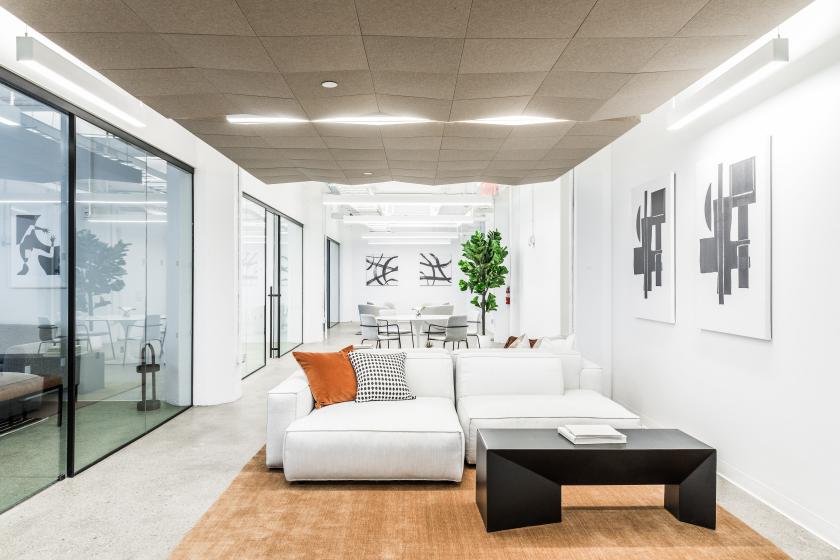
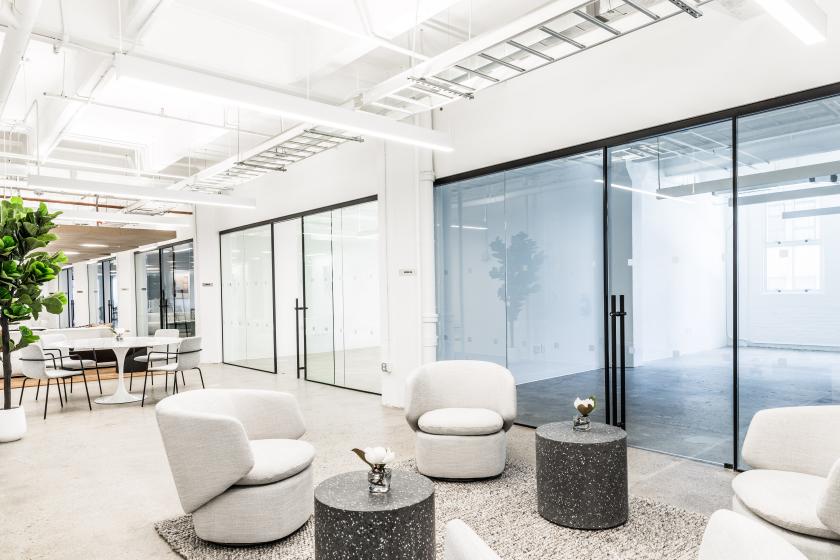
- • Conference rooms, communal kitchen, lounge areas
- • 14 high ceilings
- • Designated lobby
- • Oversized windows
- • PATH access 2 blocks away minutes to NYC
Additional Photos


Listing Agents

Julia Camacho
O: 201-795-9200
jcamacho@gfpre.com
O: 201-795-9200
jcamacho@gfpre.com
While we strive to provide the most accurate information, all listing information, and demographic data, is provided by third-parties. As such, MyEListing will not be responsible for the accuracy of the information. It is strongly recommended that you verify all information with the listing agent, and any relevant agencies, prior to making any decisions.