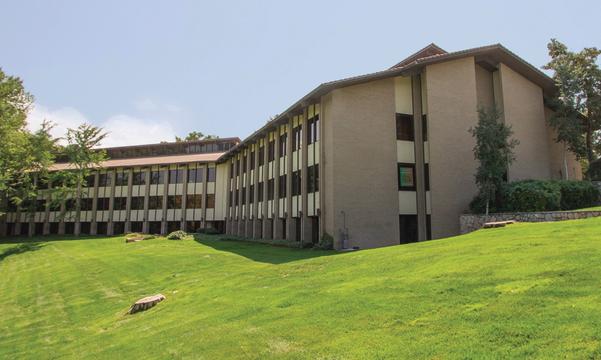
Office Space
4885 South 900 East Salt Lake City, UT 84117
4885 South 900 East Salt Lake City, UT 84117
Details & Description
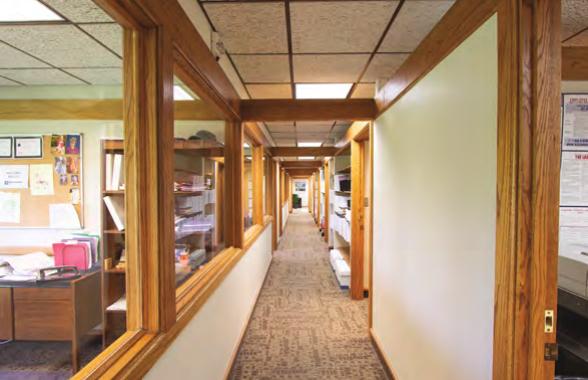
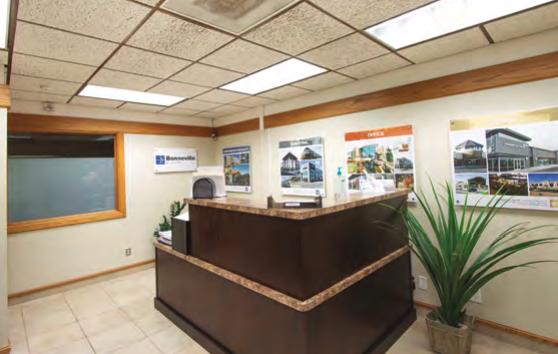
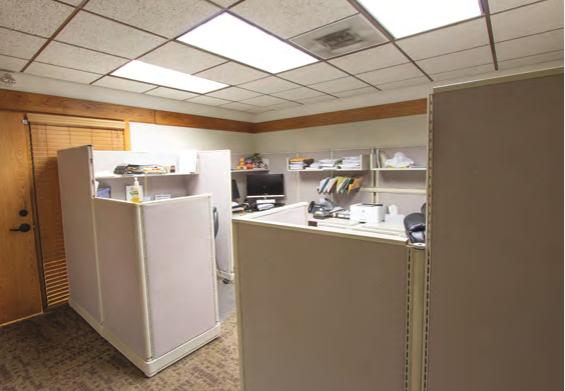
Additional Photos

Listing Agents

Patrick Lucero
O: 801-961-1000
plucero@naipremier.com
O: 801-961-1000
plucero@naipremier.com

Scott Price
O: 801-673-5525
M: 801-673-5525
sprice@naipremier.com
O: 801-673-5525
M: 801-673-5525
sprice@naipremier.com

Artie Lucero
M: 801-608-4909
artie@naipremier.com
M: 801-608-4909
artie@naipremier.com
While we strive to provide the most accurate information, all listing information, and demographic data, is provided by third-parties. As such, MyEListing will not be responsible for the accuracy of the information. It is strongly recommended that you verify all information with the listing agent, and any relevant agencies, prior to making any decisions.


