HUGE 50% PRICE REDUCTION!
* Reduced from $752,000
* Now $374,000 ($1.00 per Sq. Ft)
* Minerals not included.
Location highlights:
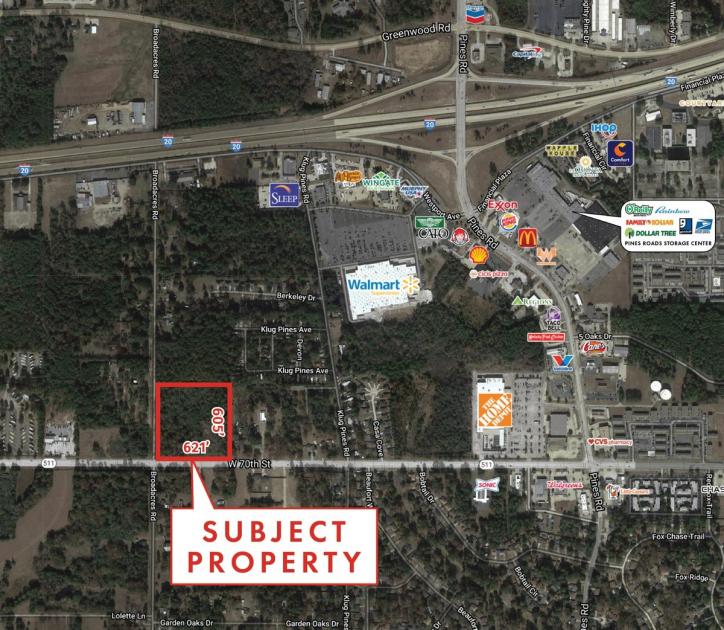
* A great corner location in West Shreveport;
* In City of Shreveport (200,000+/- pop) and parish of Caddo (246,580+/- pop) & 4 parish metro area (444,000+/- pop);
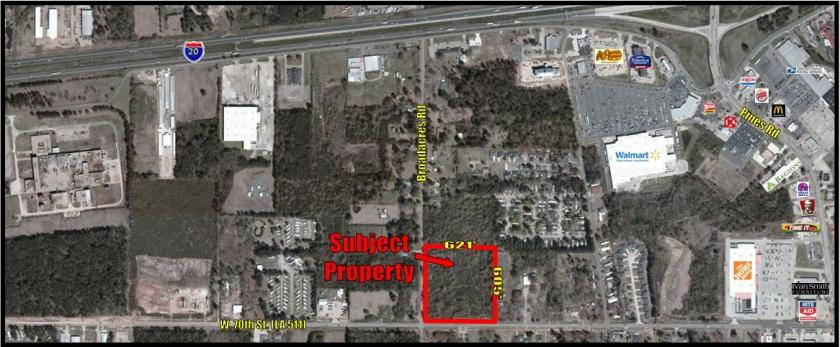
* At the NE corner of the intersection of 5 lane W. 70th St. (LA 511) at Broadacres Rd.(2 lane);
* 0.6± miles west of Pines Rd and 1.5± miles east of Bert Kouns Industrial Loop Expressway (LA 526);
* 1.5 Miles east of W. Bert Kouns Industrial Loop Expressway (LA 526)
Property Highlights:
* In Opportunity Zone;
* Corner lot;
* Excellent access & visibility to all passing traffic;
* Generally level, well drained, mostly covered in pine and hardwood timber;
* Served by City of Shreveport water (16" & 12" mains) & sanitary sewer (6" &10" mains) * AEP-Swepco electricity * Center Point Energy natural gas;
* Long road frontage on both West 70th St. (621’) and Broadacres Rd. (605’);
* An excellent building site for a variety of commercial uses, including office, retail, healthcare, and possible residential;
* Zoned C-3 Commercial;
* Inside City of Shreveport;
* Quick & easy access to all of Shreveport, Bossier City & surrounding areas & east Texas;
* Broker/Owner
No part of this information may be copied, reproduced, repurposed, or screen-captured for any commercial purpose without prior written authorization from MyEListing.
While we strive to provide the most accurate information, all listing information, and demographic data, is provided by third-parties. As such, MyEListing will not be responsible for the accuracy of the information. It is strongly recommended that you verify all information with the listing agent, and any relevant agencies, prior to making any decisions.
What is the asking price for 6388 West 70th Street in Shreveport?
The asking price for 6388 West 70th Street is $374,000
How much land does the Shreveport, LA property at 6388 West 70th Street include?
6388 West 70th Street in Shreveport includes 8.580 acres of land
What kind of Land is the propery at 6388 West 70th Street?
The property at 6388 West 70th Street Shreveport, LA 71129 is listed as a Mixed Use Land Land property
What is the population within 1 mile of 6388 West 70th Street in Shreveport?
The population within 1 mile of 6388 West 70th Street Shreveport, LA 71129 is 2,671 people.
Who do I contact for questions about 6388 West 70th Street?
You should contact the listing agent,
James Dowling, for any details regarding this commercial listing.