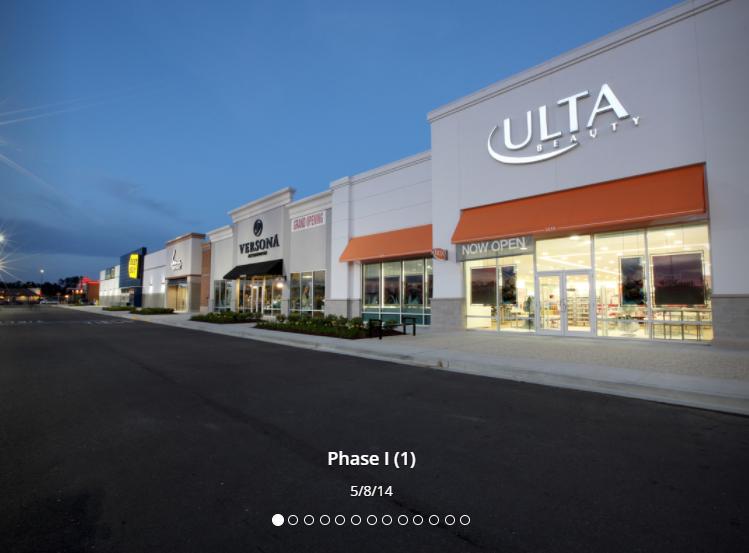
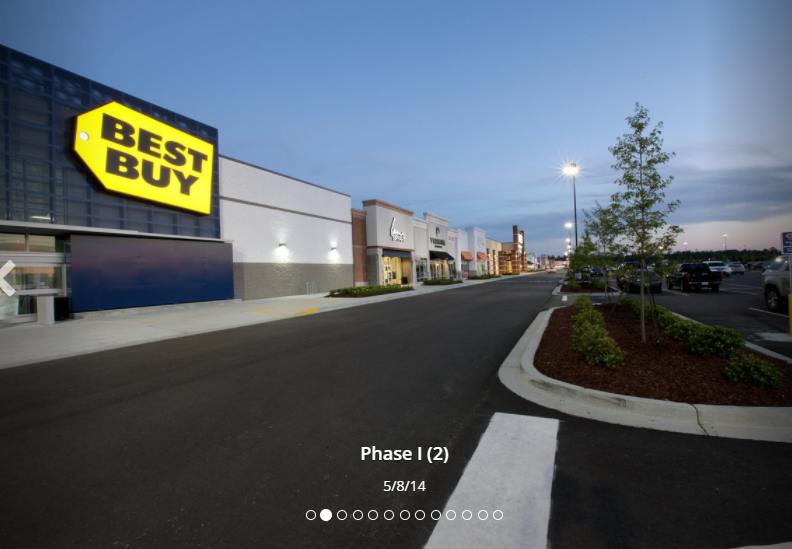
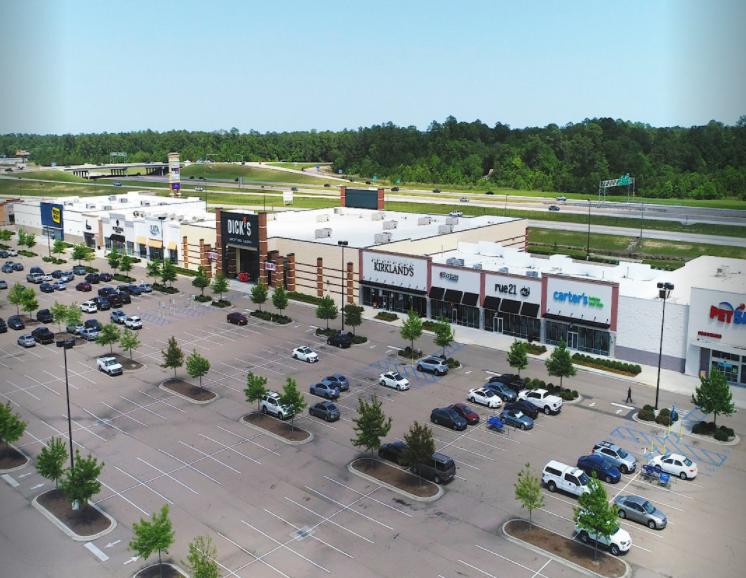
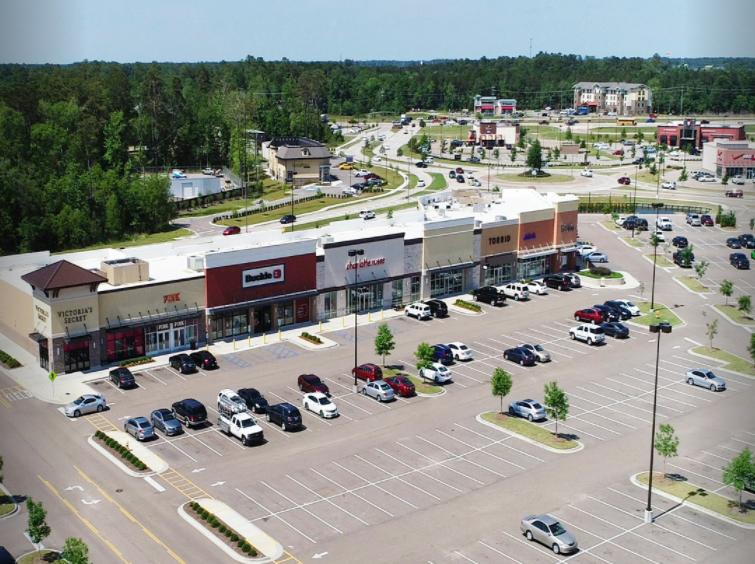
1-Mile | 3-Miles | 5-Miles | ||
---|---|---|---|---|
Total Population | 5,568 | 52,111 | 83,566 | |
Population Median Age | 39 | 39 | 40 | |
Population by Age | 0-9 Yrs | 685 (12%) | 6615 (12%) | 10246 (12%) |
10-19 Yrs | 708 (12%) | 7110 (13%) | 10914 (13%) | |
20-29 Yrs | 768 (13%) | 6330 (12%) | 9409 (11%) | |
30-39 Yrs | 784 (14%) | 7351 (14%) | 10948 (13%) | |
40-49 Yrs | 701 (12%) | 6711 (12%) | 10651 (12%) | |
50-59 Yrs | 651 (11%) | 6485 (12%) | 11391 (13%) | |
60-69 Yrs | 615 (11%) | 6166 (11%) | 10951 (13%) | |
70+ Yrs | 655 (11%) | 5343 (10%) | 9056 (10%) | |
Median HH Income | $53,071 | $59,366 | $60,587 | |
Total Household Income | < 24K | 595 (28%) | 3751 (20%) | 6208 (19%) |
25-49K | 407 (19%) | 4140 (22%) | 6712 (21%) | |
50-74K | 345 (16%) | 3132 (16%) | 5206 (16%) | |
75-99K | 309 (14%) | 2952 (15%) | 4910 (15%) | |
100-199K | 363 (17%) | 3836 (20%) | 6287 (20%) | |
200K+ | 59 (2%) | 825 (4%) | 1794 (5%) | |
Highest Education Level | No Diploma | 492 | 4042 | 6791 |
Diploma or GED | 1064 | 10410 | 16895 | |
Some College | 845 | 9190 | 15036 | |
Assoc. Degree | 301 | 2443 | 4142 | |
Bachelors Degree | 600 | 5685 | 9844 | |
Higher Degree | 329 | 3097 | 4973 | |
Total Housing Units | 2,289 | 20,453 | 34,194 | |
--Owner-Occupied | 1,515 | 13,498 | 22,300 | |
--Renter-Occupied | 562 | 5,139 | 8,818 | |
Owner-Occupied Values | < 100K | 268 | 1585 | 2562 |
100-199K | 876 | 7517 | 9889 | |
200-299K | 314 | 3276 | 6207 | |
300-399K | 44 | 820 | 2491 | |
400-499K | 0 | 139 | 589 | |
500K+ | 13 | 162 | 562 | |
Total Working Age Population | 4,371 | 40,866 | 66,450 | |
In Work Force | 2,682 | 25,919 | 41,574 | |
Not In Work Force | 1,689 | 14,947 | 24,876 | |
Workforce Employed | 2,470 | 23,898 | 38,408 | |
Workforce Unemployed | 176 | 1,741 | 2,804 | |
Civlian Workforce | 2,646 | 25,639 | 41,212 | |
Military Workforce | 36 | 280 | 362 | |
Total Households | 2,077 | 18,637 | 31,117 | |
Family Households | 1,232 | 12,666 | 20,929 | |
Non-Family Households | 846 | 5,970 | 10,189 | |
Married Couple | 868 | 8,535 | 14,540 | |
Other Family | 364 | 4,131 | 6,389 | |
Married w/Child | 340 | 3,365 | 5,049 | |
Single Male w/Child | 34 | 520 | 720 | |
Single Female w/Child | 108 | 1,689 | 2,751 |
Population Change Last Two Decades - Plus Projection
2000 | % | 2010 | % | 2020 | % | 2030 | |
---|---|---|---|---|---|---|---|
Louisiana | 4,468,976 | +1 | 4,533,372 | +1 | 4,588,310 | +5 | 4,813,420 |
St. Bernard Parish | 67,229 | -47 | 35,897 | -38 | 22,210 | +1 | 22,480 |
St. Tammany Parish | 191,268 | +22 | 233,740 | +45 | 338,300 | +36 | 459,160 |
Mississippi | 2,844,658 | +4 | 2,967,297 | +3 | 3,066,382 | +1 | 3,104,159 |
Hancock County | 42,967 | +2 | 43,929 | +6 | 46,578 | +1 | 47,152 |
Total Working Age Population:
Total Households:
Total Working Age Population:
Total Households:
Total Working Age Population:
Total Households: