Industrial Properties
9371 Dauphin Island Parkway Theodore, AL 36582
9371 Dauphin Island Parkway Theodore, AL 36582

Details & Description
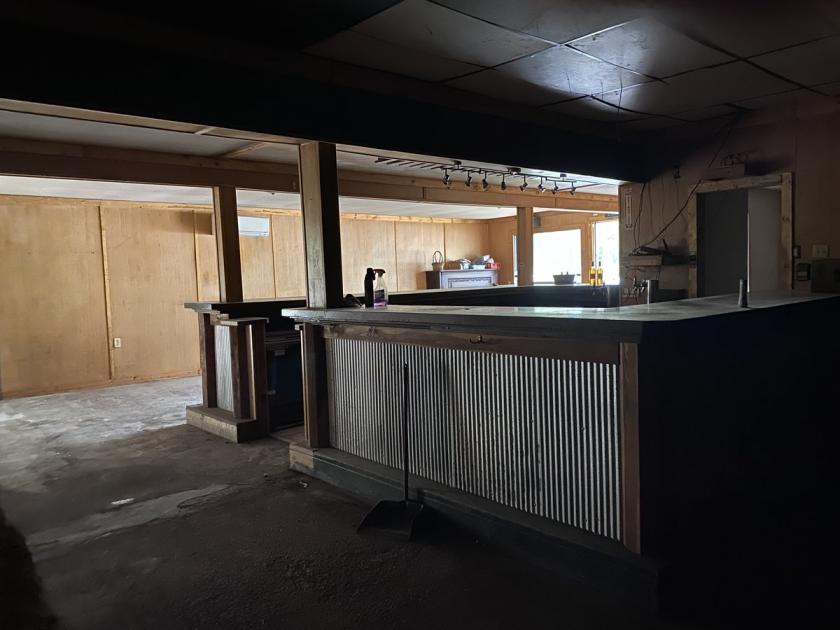
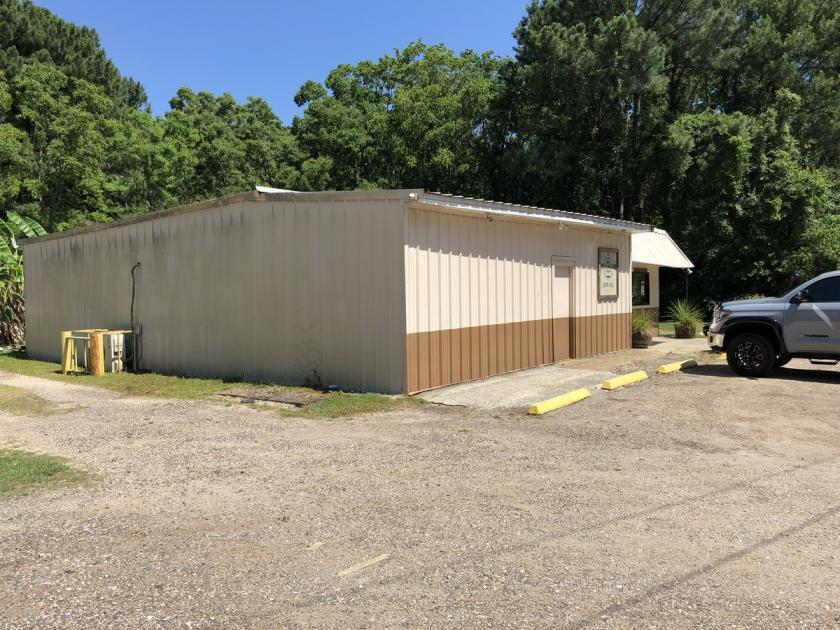
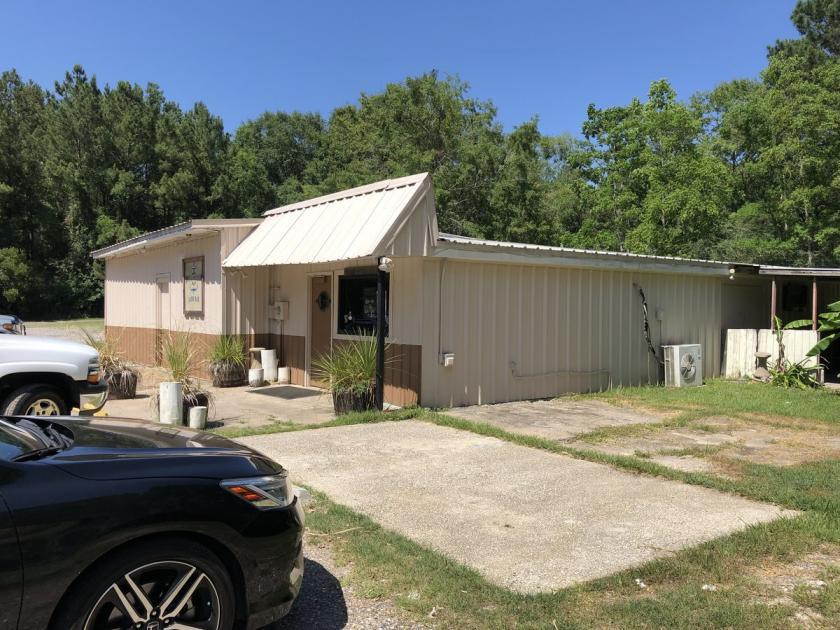
Additional Photos

Listing Agents

Angela McArthur
O: 251-375-2481
M: 251-591-3168
amcarthur@stirlingprop.com
O: 251-375-2481
M: 251-591-3168
amcarthur@stirlingprop.com
While we strive to provide the most accurate information, all listing information, and demographic data, is provided by third-parties. As such, MyEListing will not be responsible for the accuracy of the information. It is strongly recommended that you verify all information with the listing agent, and any relevant agencies, prior to making any decisions.