Industrial Properties
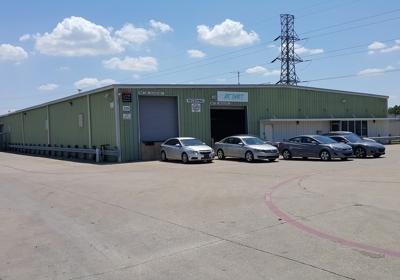
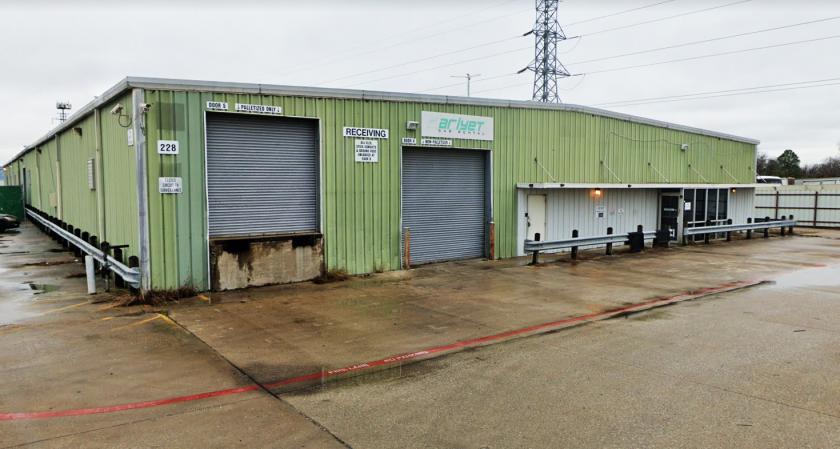
228 Irby Lane Irving, TX 75061
228 Irby Lane Irving, TX 75061
Details & Description
Listing Agents

jim Ferris
O: 972-337-9334
jferris@bradford.com
O: 972-337-9334
jferris@bradford.com
While we strive to provide the most accurate information, all listing information, and demographic data, is provided by third-parties. As such, MyEListing will not be responsible for the accuracy of the information. It is strongly recommended that you verify all information with the listing agent, and any relevant agencies, prior to making any decisions.