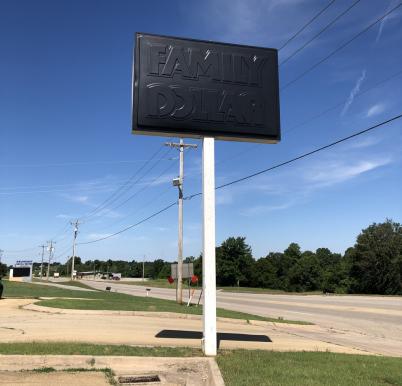
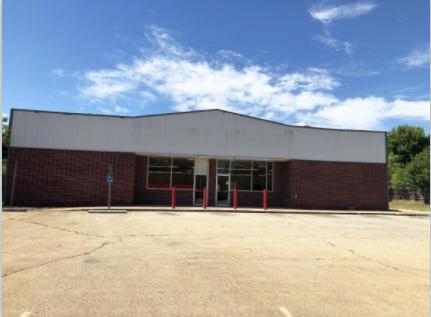
1-Mile | 3-Miles | 5-Miles | ||
---|---|---|---|---|
Total Population | 425 | 2,405 | 3,757 | |
Population Median Age | 39 | 40 | 41 | |
Population by Age | 0-9 Yrs | 39 (9%) | 232 (9%) | 385 (10%) |
10-19 Yrs | 75 (17%) | 394 (16%) | 537 (14%) | |
20-29 Yrs | 53 (12%) | 301 (12%) | 462 (12%) | |
30-39 Yrs | 49 (11%) | 263 (10%) | 369 (9%) | |
40-49 Yrs | 54 (12%) | 305 (12%) | 472 (12%) | |
50-59 Yrs | 62 (14%) | 351 (14%) | 560 (14%) | |
60-69 Yrs | 51 (12%) | 297 (12%) | 497 (13%) | |
70+ Yrs | 42 (9%) | 263 (10%) | 475 (12%) | |
Median HH Income | $36,951 | $37,729 | $38,123 | |
Total Household Income | < 24K | 59 (35%) | 334 (34%) | 526 (33%) |
25-49K | 46 (27%) | 271 (27%) | 450 (28%) | |
50-74K | 24 (14%) | 143 (14%) | 239 (15%) | |
75-99K | 22 (13%) | 117 (12%) | 167 (10%) | |
100-199K | 14 (8%) | 91 (9%) | 160 (10%) | |
200K+ | 2 (1%) | 17 (1%) | 35 (2%) | |
Highest Education Level | No Diploma | 52 | 280 | 405 |
Diploma or GED | 127 | 728 | 1166 | |
Some College | 63 | 359 | 572 | |
Assoc. Degree | 14 | 88 | 150 | |
Bachelors Degree | 22 | 128 | 206 | |
Higher Degree | 12 | 70 | 113 | |
Total Housing Units | 204 | 1,195 | 1,952 | |
--Owner-Occupied | 103 | 631 | 1,090 | |
--Renter-Occupied | 65 | 342 | 488 | |
Owner-Occupied Values | < 100K | 69 | 405 | 659 |
100-199K | 21 | 132 | 240 | |
200-299K | 7 | 58 | 126 | |
300-399K | 5 | 26 | 38 | |
400-499K | 0 | 3 | 8 | |
500K+ | 1 | 8 | 19 | |
Total Working Age Population | 332 | 1,897 | 3,011 | |
In Work Force | 191 | 1,089 | 1,702 | |
Not In Work Force | 141 | 807 | 1,309 | |
Workforce Employed | 181 | 1,034 | 1,618 | |
Workforce Unemployed | 10 | 55 | 84 | |
Civlian Workforce | 191 | 1,089 | 1,702 | |
Military Workforce | 0 | 0 | 0 | |
Total Households | 167 | 974 | 1,577 | |
Family Households | 99 | 578 | 950 | |
Non-Family Households | 68 | 395 | 627 | |
Married Couple | 59 | 363 | 639 | |
Other Family | 40 | 215 | 311 | |
Married w/Child | 24 | 142 | 228 | |
Single Male w/Child | 7 | 34 | 48 | |
Single Female w/Child | 21 | 103 | 134 |
Population Change Last Two Decades - Plus Projection
2000 | % | 2010 | % | 2020 | % | 2030 | |
---|---|---|---|---|---|---|---|
Oklahoma | 3,450,654 | +9 | 3,751,351 | +7 | 4,024,202 | +7 | 4,302,501 |
Creek County | 67,367 | +4 | 69,967 | +8 | 75,823 | +8 | 81,992 |
Lincoln County | 32,080 | +7 | 34,273 | +9 | 37,260 | +9 | 40,558 |
Payne County | 68,190 | +13 | 77,350 | +9 | 84,341 | +8 | 90,773 |
Total Working Age Population:
Total Households:
Total Working Age Population:
Total Households:
Total Working Age Population:
Total Households: