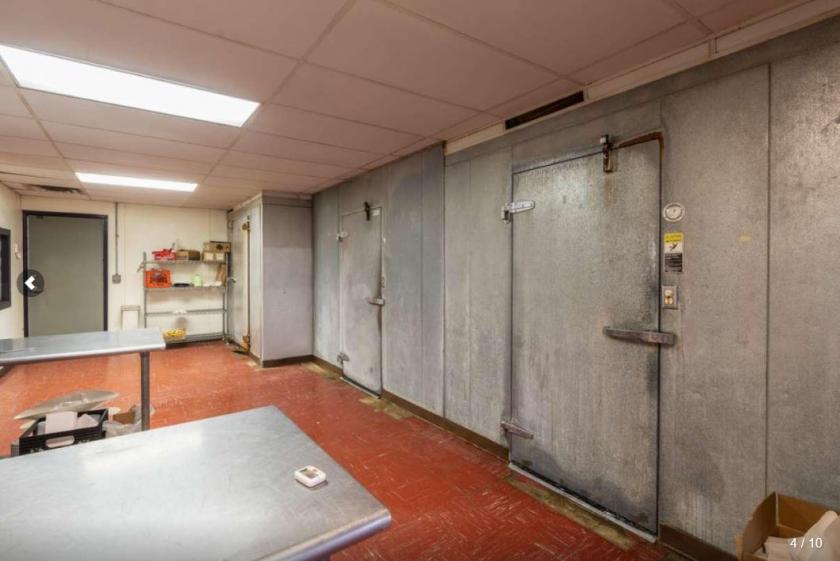
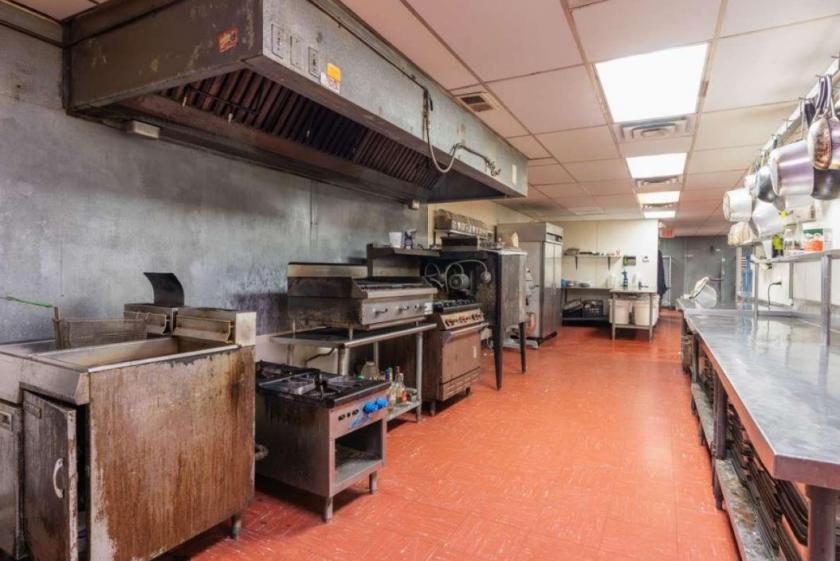
1-Mile | 3-Miles | 5-Miles | ||
---|---|---|---|---|
Total Population | 13,658 | 92,327 | 222,087 | |
Population Median Age | 34 | 35 | 36 | |
Population by Age | 0-9 Yrs | 2342 (17%) | 13111 (14%) | 31541 (14%) |
10-19 Yrs | 1590 (11%) | 11290 (12%) | 28197 (12%) | |
20-29 Yrs | 2219 (16%) | 17218 (18%) | 38611 (17%) | |
30-39 Yrs | 2471 (18%) | 15143 (16%) | 34509 (15%) | |
40-49 Yrs | 1739 (12%) | 10899 (11%) | 26268 (11%) | |
50-59 Yrs | 1569 (11%) | 10413 (11%) | 25371 (11%) | |
60-69 Yrs | 889 (6%) | 8285 (8%) | 20656 (9%) | |
70+ Yrs | 839 (6%) | 5967 (6%) | 16936 (7%) | |
Median HH Income | $46,646 | $43,064 | $46,829 | |
Total Household Income | < 24K | 1402 (25%) | 10200 (28%) | 22233 (25%) |
25-49K | 1500 (27%) | 10362 (28%) | 23672 (27%) | |
50-74K | 1357 (25%) | 7020 (19%) | 16880 (19%) | |
75-99K | 624 (11%) | 3843 (10%) | 9332 (10%) | |
100-199K | 476 (8%) | 4115 (11%) | 11129 (12%) | |
200K+ | 37 (0%) | 629 (1%) | 3291 (3%) | |
Highest Education Level | No Diploma | 2128 | 11988 | 27549 |
Diploma or GED | 2886 | 16965 | 38743 | |
Some College | 1730 | 13100 | 31037 | |
Assoc. Degree | 503 | 3973 | 9154 | |
Bachelors Degree | 1233 | 9892 | 25566 | |
Higher Degree | 498 | 4413 | 14056 | |
Total Housing Units | 5,910 | 42,007 | 101,055 | |
--Owner-Occupied | 2,911 | 17,498 | 43,935 | |
--Renter-Occupied | 2,485 | 18,671 | 42,602 | |
Owner-Occupied Values | < 100K | 1689 | 7793 | 17281 |
100-199K | 994 | 7520 | 17763 | |
200-299K | 143 | 1663 | 4604 | |
300-399K | 27 | 249 | 1544 | |
400-499K | 18 | 111 | 884 | |
500K+ | 40 | 162 | 1860 | |
Total Working Age Population | 10,380 | 72,522 | 173,103 | |
In Work Force | 7,257 | 49,520 | 114,551 | |
Not In Work Force | 3,123 | 23,001 | 58,552 | |
Workforce Employed | 6,990 | 47,029 | 108,326 | |
Workforce Unemployed | 244 | 2,408 | 5,824 | |
Civlian Workforce | 7,234 | 49,438 | 114,150 | |
Military Workforce | 23 | 83 | 401 | |
Total Households | 5,397 | 36,169 | 86,537 | |
Family Households | 2,821 | 18,976 | 47,391 | |
Non-Family Households | 2,576 | 17,193 | 39,145 | |
Married Couple | 1,970 | 11,895 | 30,930 | |
Other Family | 851 | 7,081 | 16,462 | |
Married w/Child | 1,084 | 5,106 | 12,927 | |
Single Male w/Child | 106 | 889 | 2,155 | |
Single Female w/Child | 330 | 3,024 | 7,196 |
Population Change Last Two Decades - Plus Projection
2000 | % | 2010 | % | 2020 | % | 2030 | |
---|---|---|---|---|---|---|---|
Oklahoma | 3,450,654 | +9 | 3,751,351 | +7 | 4,024,202 | +7 | 4,302,501 |
Canadian County | 87,697 | +32 | 115,541 | +16 | 133,468 | +13 | 151,440 |
Oklahoma County | 660,448 | +9 | 718,633 | +7 | 772,053 | +6 | 821,230 |
Total Working Age Population:
Total Households:
Total Working Age Population:
Total Households:
Total Working Age Population:
Total Households: