- +/- 5.20 acres (all utilities to site)
- Zoning: E (Neighborhood Commercial)
- Zoning allows for many possible uses, including retail, office, medical, education facility, convenience store, and gas station
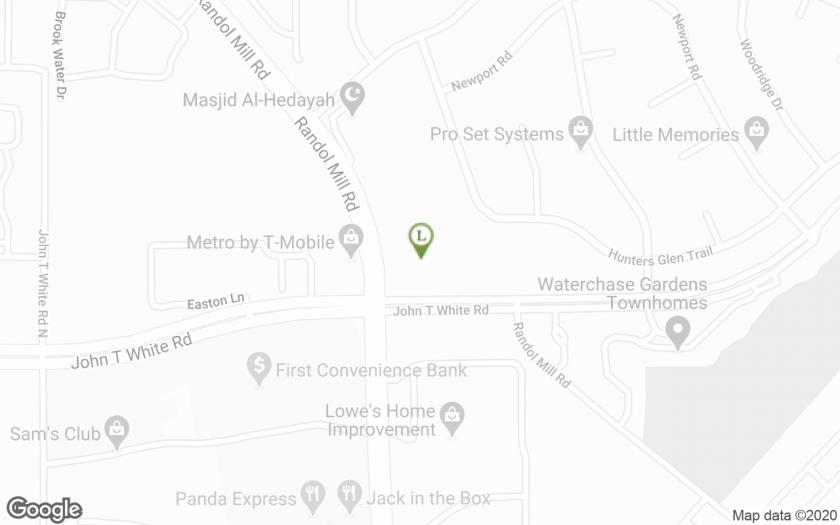
- +/- 240' of frontage along John T. White Road and +/- 305' along Eastchase Parkway
- Shadow anchored by Walmart Supercenter, Sam's Club, and Lowes Home Improvement
- Surrounded by dense residential and multi-family development, including DR Horton's new 219 home community- Trinity Oaks
- Adjacent to planned development projects, including the construction of Hampton Inn and Marriott hotels
- Traffic volume in excess of 100,000 VPD
No part of this information may be copied, reproduced, repurposed, or screen-captured for any commercial purpose without prior written authorization from MyEListing.
While we strive to provide the most accurate information, all listing information, and demographic data, is provided by third-parties. As such, MyEListing will not be responsible for the accuracy of the information. It is strongly recommended that you verify all information with the listing agent, and any relevant agencies, prior to making any decisions.
What is the asking price for 8661 John T White Road in Fort Worth?
The asking price for 8661 John T White Road is $1,098,583
How much land does the Fort Worth, TX property at 8661 John T White Road include?
8661 John T White Road in Fort Worth includes 5.200 acres of land
What kind of Land is the propery at 8661 John T White Road?
The property at 8661 John T White Road Fort Worth, TX 76120 is listed as a Mixed Use Land Land property
What is the population within 1 mile of 8661 John T White Road in Fort Worth?
The population within 1 mile of 8661 John T White Road Fort Worth, TX 76120 is 6,036 people.
Who do I contact for questions about 8661 John T White Road?
You should contact the listing agent,
Erik Blais, for any details regarding this commercial listing.