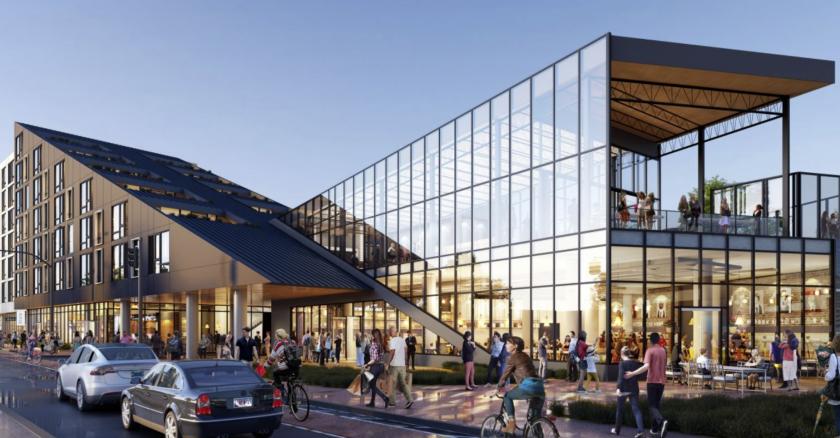
New Mixed Use Development
The Shops at Triangle Square will include Approximately 25,000 sq ft of Future Retail Space along Elston Avenue
Up to 11,000 sf Hard Corner 1st Floor Retail with Drive-Thru Options
*Potential 2nd Floor Space Available
Approximately 25,000 sf along Elston Ave
5,929 sf divisible
6,966 sf divisible *black iron
8,328 sf divisible
Approximately 75 Dedicated Retail Parking Spaces Available
Anchored by Two 7-story Luxury Residential Buildings (366 units)
Condo Building Consists of 66 Homes along Webster Ave
Apartment Building Consists of 300 units along Elston Ave (*delivery summer 2021)
No part of this information may be copied, reproduced, repurposed, or screen-captured for any commercial purpose without prior written authorization from MyEListing.
While we strive to provide the most accurate information, all listing information, and demographic data, is provided by third-parties. As such, MyEListing will not be responsible for the accuracy of the information. It is strongly recommended that you verify all information with the listing agent, and any relevant agencies, prior to making any decisions.
What is the building size of this commercial Retail property?
The size of this multi-unit property varies between 6966 - 11000 square feet
What kind of Retail is the propery at 2155 N Elston Ave?
The property at 2155 N Elston Ave Chicago, IL 60614 is listed as a Shopping Center Retail property
What is the population within 1 mile of 2155 N Elston Ave in Chicago?
The population within 1 mile of 2155 N Elston Ave Chicago, IL 60614 is 55,230 people.
Who do I contact for questions about 2155 N Elston Ave?
You should contact the listing agent,
Robert Melsher, for any details regarding this commercial listing.