Retail Space
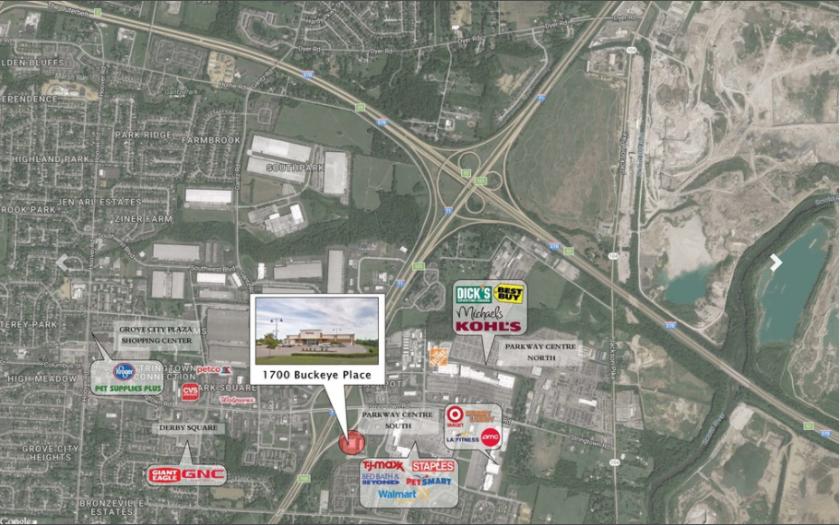
1700 Buckeye Place Grove City, OH 43123
1700 Buckeye Place Grove City, OH 43123
Details & Description
Property Highlights
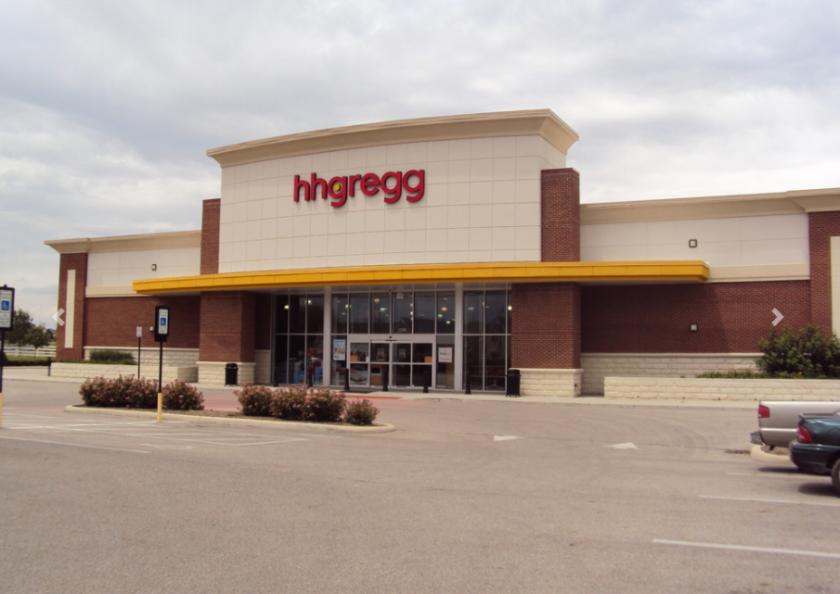
- • Freestanding building for auction
- • Maximum exposure facing I-71
- • Very tight retail corridor
Listing Agents

Michael Nolan
O: 614-228-2222
M: 614-674-6942
mnolan@gilbertgrouprealestate.com
O: 614-228-2222
M: 614-674-6942
mnolan@gilbertgrouprealestate.com
While we strive to provide the most accurate information, all listing information, and demographic data, is provided by third-parties. As such, MyEListing will not be responsible for the accuracy of the information. It is strongly recommended that you verify all information with the listing agent, and any relevant agencies, prior to making any decisions.