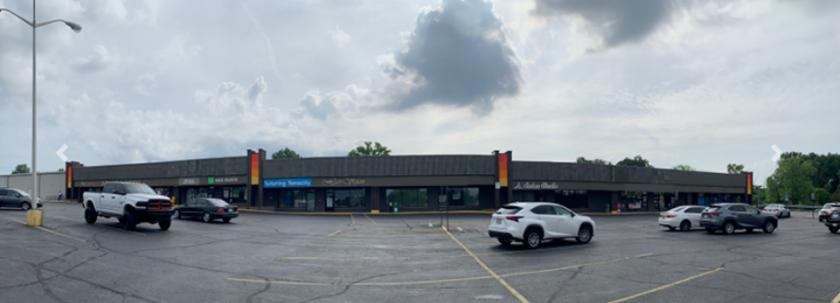
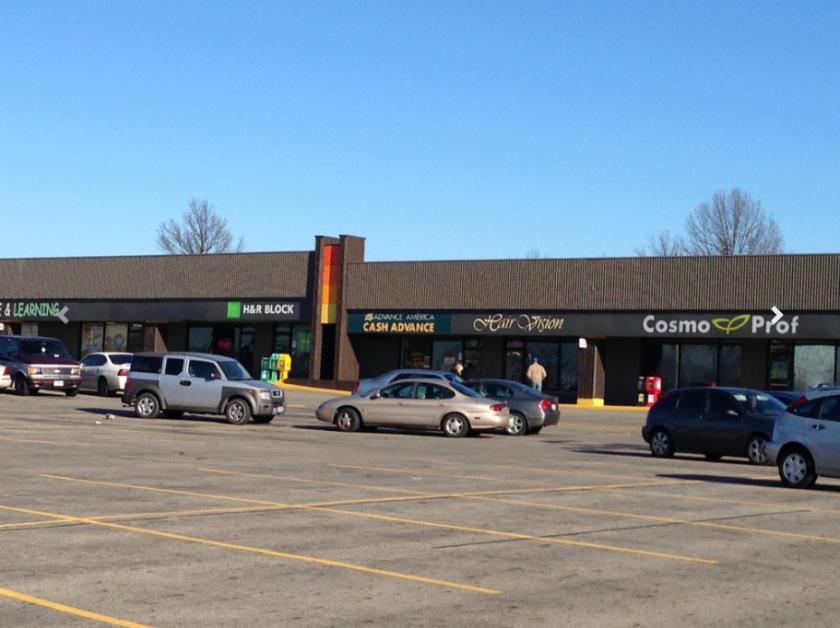
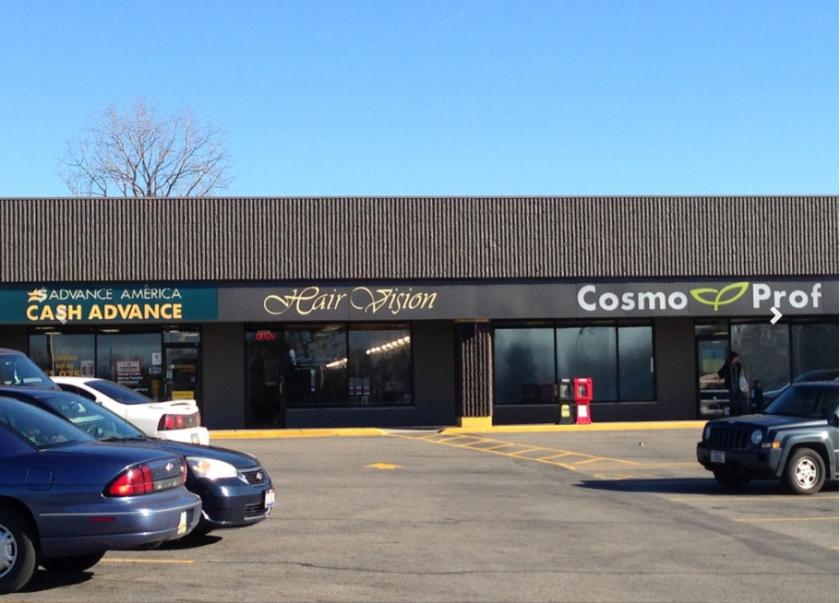
1-Mile | 3-Miles | 5-Miles | ||
---|---|---|---|---|
Total Population | 15,236 | 107,094 | 233,779 | |
Population Median Age | 39 | 36 | 36 | |
Population by Age | 0-9 Yrs | 1915 (12%) | 14467 (13%) | 33774 (14%) |
10-19 Yrs | 1836 (12%) | 13944 (13%) | 31454 (13%) | |
20-29 Yrs | 2329 (15%) | 16507 (15%) | 33821 (14%) | |
30-39 Yrs | 1801 (11%) | 16537 (15%) | 36097 (15%) | |
40-49 Yrs | 1755 (11%) | 12960 (12%) | 29216 (12%) | |
50-59 Yrs | 2256 (14%) | 13835 (12%) | 29760 (12%) | |
60-69 Yrs | 1372 (9%) | 10514 (9%) | 23395 (10%) | |
70+ Yrs | 1972 (12%) | 8330 (7%) | 16261 (6%) | |
Median HH Income | $50,380 | $52,958 | $54,743 | |
Total Household Income | < 24K | 1247 (20%) | 7937 (18%) | 17846 (19%) |
25-49K | 1785 (29%) | 12117 (28%) | 23995 (26%) | |
50-74K | 1177 (19%) | 9244 (21%) | 17958 (19%) | |
75-99K | 762 (12%) | 5841 (13%) | 11932 (13%) | |
100-199K | 1099 (17%) | 6786 (15%) | 17180 (18%) | |
200K+ | 41 (0%) | 743 (1%) | 2585 (2%) | |
Highest Education Level | No Diploma | 1118 | 6042 | 14049 |
Diploma or GED | 3546 | 23439 | 46918 | |
Some College | 2530 | 17274 | 36825 | |
Assoc. Degree | 845 | 6259 | 13080 | |
Bachelors Degree | 1770 | 12621 | 28695 | |
Higher Degree | 685 | 6053 | 14492 | |
Total Housing Units | 6,411 | 45,105 | 97,873 | |
--Owner-Occupied | 3,061 | 21,062 | 47,635 | |
--Renter-Occupied | 3,051 | 21,607 | 43,861 | |
Owner-Occupied Values | < 100K | 506 | 5691 | 12588 |
100-199K | 2172 | 11243 | 21879 | |
200-299K | 283 | 3365 | 9891 | |
300-399K | 74 | 539 | 2048 | |
400-499K | 25 | 83 | 597 | |
500K+ | 1 | 140 | 633 | |
Total Working Age Population | 12,358 | 84,171 | 180,241 | |
In Work Force | 8,293 | 59,857 | 128,009 | |
Not In Work Force | 4,065 | 24,314 | 52,233 | |
Workforce Employed | 7,718 | 56,057 | 120,181 | |
Workforce Unemployed | 576 | 3,761 | 7,697 | |
Civlian Workforce | 8,293 | 59,818 | 127,878 | |
Military Workforce | 0 | 40 | 131 | |
Total Households | 6,111 | 42,668 | 91,496 | |
Family Households | 3,714 | 25,822 | 57,360 | |
Non-Family Households | 2,397 | 16,846 | 34,136 | |
Married Couple | 2,185 | 15,108 | 34,432 | |
Other Family | 1,529 | 10,714 | 22,929 | |
Married w/Child | 659 | 6,302 | 14,604 | |
Single Male w/Child | 176 | 1,003 | 2,655 | |
Single Female w/Child | 638 | 5,216 | 11,076 |
Population Change Last Two Decades - Plus Projection
2000 | % | 2010 | % | 2020 | % | 2030 | |
---|---|---|---|---|---|---|---|
Ohio | 11,353,140 | +2 | 11,536,504 | 0 | 11,574,870 | 0 | 11,615,100 |
Fairfield County | 122,759 | +19 | 146,156 | +7 | 157,040 | +9 | 170,630 |
Franklin County | 1,068,978 | +9 | 1,163,414 | +11 | 1,291,320 | +8 | 1,394,980 |
Licking County | 145,491 | +14 | 166,492 | +9 | 180,860 | +9 | 196,570 |
Total Working Age Population:
Total Households:
Total Working Age Population:
Total Households:
Total Working Age Population:
Total Households: