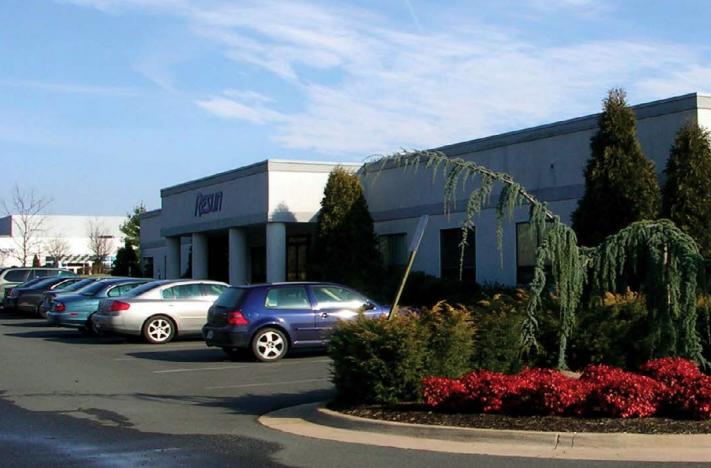
Office Space
22810 Quicksilver Drive Sterling, VA 20166
22810 Quicksilver Drive Sterling, VA 20166
Details & Description
Property Highlights
- • Full office building
- • 2 Conference Rooms
- • Executive office suites
- • 500 SF Data Center
- • 22 Individual offices and open workspace
- • Gym with locker room
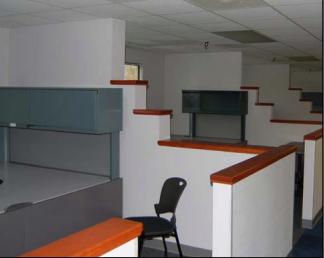
Additional Photos


Listing Agents

Kevin Goeller
O: 703-268-2730
M: 703-929-2142
kgoeller@klnb.com
O: 703-268-2730
M: 703-929-2142
kgoeller@klnb.com

Chase Stewart
O: 703-268-2732
M: 703-489-5649
cstewart@klnb.com
O: 703-268-2732
M: 703-489-5649
cstewart@klnb.com

Ryan Goeller
O: 703-268-2731
M: 571-278-8297
rgoeller@klnb.com
O: 703-268-2731
M: 571-278-8297
rgoeller@klnb.com
While we strive to provide the most accurate information, all listing information, and demographic data, is provided by third-parties. As such, MyEListing will not be responsible for the accuracy of the information. It is strongly recommended that you verify all information with the listing agent, and any relevant agencies, prior to making any decisions.


