Retail Space
3870 Main Street Hilliard, OH 43026
3870 Main Street Hilliard, OH 43026

Details & Description
Property Highlights
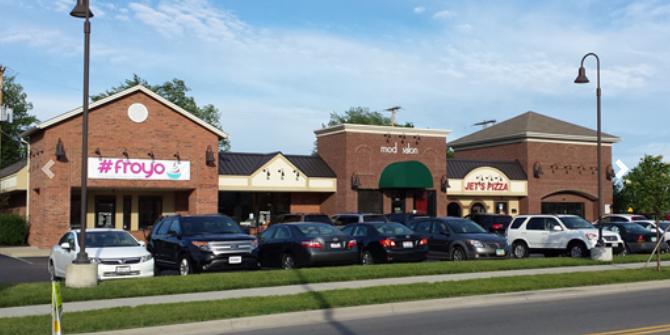
- • End cap suite available for sublease
- • Excellent visibility from Main Street
- • Traffic Counts 13,000 VPD
Listing Agents

Carlton Dargusch
O: 614-228-2222
M: 614-674-6943
cdargusch@gilbertgrouprealestate.com
O: 614-228-2222
M: 614-674-6943
cdargusch@gilbertgrouprealestate.com
While we strive to provide the most accurate information, all listing information, and demographic data, is provided by third-parties. As such, MyEListing will not be responsible for the accuracy of the information. It is strongly recommended that you verify all information with the listing agent, and any relevant agencies, prior to making any decisions.