AMENITIES
24/7 security
Card access control system
Full-service kitchen
Outdoor patio and seating
Exercise facility
Basketball and volleyball courts
Adjacent to Louisville open space with multiple trails and bike paths
Convenient access to US Hwy 36 and numerous amenities within walking distance
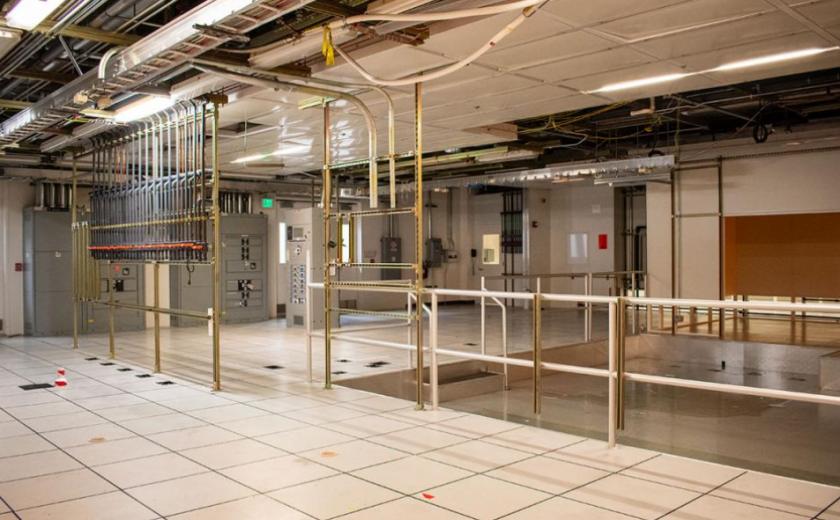
POWER AND MECHANICAL SYSTEMS
16,000 + amp of power
Redundant power source
HVAC Mechanical 24/7
Extensive Emergency Back-up power
Redundant Electrical, Heating and Cooling Service
Chemical Control Infrastructure in Place
Special Utility Systems Including; Acid Neutralization Equipment, Heavy Metal Removal System, De-Ionized Water System, Refrigeration Equipment
No part of this information may be copied, reproduced, repurposed, or screen-captured for any commercial purpose without prior written authorization from MyEListing.
While we strive to provide the most accurate information, all listing information, and demographic data, is provided by third-parties. As such, MyEListing will not be responsible for the accuracy of the information. It is strongly recommended that you verify all information with the listing agent, and any relevant agencies, prior to making any decisions.
What is the asking price for 1450 Infinite Drive in Louisville?
The asking price for 1450 Infinite Drive is $25.00 - $35.00 a SF per Year
What is the building size of this commercial Office property?
The size of this multi-unit property varies between 6540 - 63744 square feet
What kind of Office is the propery at 1450 Infinite Drive?
The property at 1450 Infinite Drive Louisville, CO 80027 is listed as a Professional Office property
What is the population within 1 mile of 1450 Infinite Drive in Louisville?
The population within 1 mile of 1450 Infinite Drive Louisville, CO 80027 is 2,744 people.
Who do I contact for questions about 1450 Infinite Drive?
You should contact the listing agent,
Becky Gamble, for any details regarding this commercial listing.