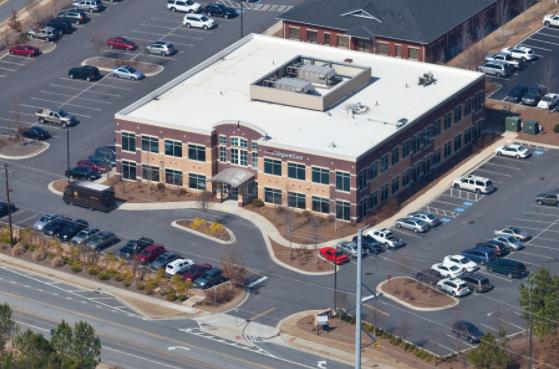
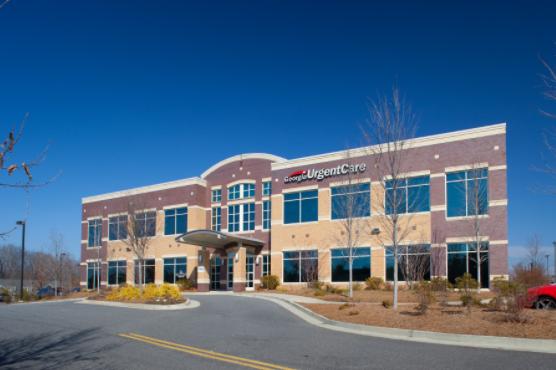
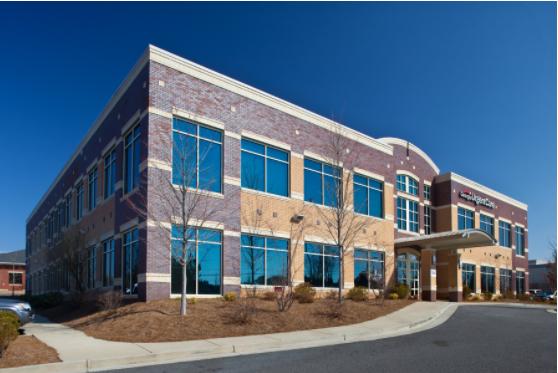
1-Mile | 3-Miles | 5-Miles | ||
---|---|---|---|---|
Total Population | 6,330 | 64,901 | 174,252 | |
Population Median Age | 37 | 37 | 37 | |
Population by Age | 0-9 Yrs | 943 (14%) | 8911 (13%) | 23735 (13%) |
10-19 Yrs | 979 (15%) | 9325 (14%) | 24972 (14%) | |
20-29 Yrs | 501 (7%) | 6641 (10%) | 17371 (9%) | |
30-39 Yrs | 1009 (15%) | 9740 (15%) | 26409 (15%) | |
40-49 Yrs | 986 (15%) | 10145 (15%) | 26633 (15%) | |
50-59 Yrs | 724 (11%) | 8792 (13%) | 25995 (14%) | |
60-69 Yrs | 596 (9%) | 6534 (10%) | 17326 (9%) | |
70+ Yrs | 592 (9%) | 4813 (7%) | 11811 (6%) | |
Median HH Income | $76,242 | $92,580 | $99,778 | |
Total Household Income | < 24K | 151 (6%) | 2016 (8%) | 5495 (8%) |
25-49K | 527 (23%) | 4336 (18%) | 9928 (15%) | |
50-74K | 440 (19%) | 3735 (15%) | 9277 (14%) | |
75-99K | 310 (13%) | 2632 (11%) | 7492 (11%) | |
100-199K | 572 (25%) | 7185 (30%) | 19365 (30%) | |
200K+ | 268 (11%) | 3972 (16%) | 12695 (19%) | |
Highest Education Level | No Diploma | 209 | 3375 | 6535 |
Diploma or GED | 768 | 5929 | 13880 | |
Some College | 866 | 6658 | 17934 | |
Assoc. Degree | 237 | 2449 | 6673 | |
Bachelors Degree | 1351 | 15746 | 44978 | |
Higher Degree | 820 | 9752 | 28013 | |
Total Housing Units | 2,433 | 25,414 | 68,608 | |
--Owner-Occupied | 1,293 | 14,049 | 42,145 | |
--Renter-Occupied | 975 | 9,827 | 22,107 | |
Owner-Occupied Values | < 100K | 38 | 370 | 1258 |
100-199K | 280 | 1924 | 4613 | |
200-299K | 351 | 2806 | 7967 | |
300-399K | 288 | 3406 | 9912 | |
400-499K | 184 | 2320 | 6985 | |
500K+ | 153 | 3222 | 11409 | |
Total Working Age Population | 4,789 | 50,223 | 134,851 | |
In Work Force | 3,388 | 35,834 | 96,286 | |
Not In Work Force | 1,402 | 14,389 | 38,566 | |
Workforce Employed | 3,269 | 34,464 | 92,552 | |
Workforce Unemployed | 119 | 1,336 | 3,620 | |
Civlian Workforce | 3,388 | 35,800 | 96,173 | |
Military Workforce | 0 | 34 | 113 | |
Total Households | 2,268 | 23,876 | 64,252 | |
Family Households | 1,448 | 16,090 | 44,445 | |
Non-Family Households | 820 | 7,786 | 19,807 | |
Married Couple | 1,064 | 12,520 | 36,069 | |
Other Family | 384 | 3,571 | 8,376 | |
Married w/Child | 540 | 6,377 | 18,483 | |
Single Male w/Child | 23 | 597 | 1,272 | |
Single Female w/Child | 275 | 1,589 | 3,812 |
Population Change Last Two Decades - Plus Projection
2000 | % | 2010 | % | 2020 | % | 2030 | |
---|---|---|---|---|---|---|---|
Georgia | 8,186,453 | +18 | 9,687,653 | +12 | 10,833,472 | +13 | 12,292,423 |
Cherokee County | 141,903 | +51 | 214,346 | +24 | 266,617 | +20 | 320,849 |
Cobb County | 607,751 | +13 | 688,078 | +15 | 790,588 | +19 | 938,747 |
Forsyth County | 98,407 | +78 | 175,511 | +44 | 252,507 | +35 | 341,646 |
Fulton County | 816,006 | +13 | 920,581 | +19 | 1,099,181 | +18 | 1,300,861 |
Gwinnett County | 588,448 | +37 | 805,321 | +21 | 971,145 | +21 | 1,175,358 |
Total Working Age Population:
Total Households:
Total Working Age Population:
Total Households:
Total Working Age Population:
Total Households: